Study results
The research data from the slash in stream studies show which variables are the best predictors of channel disturbance.
On this page:
Results
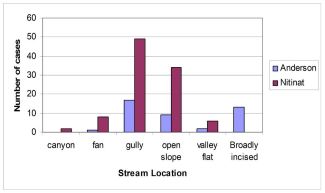
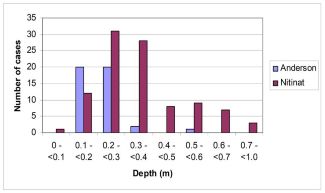
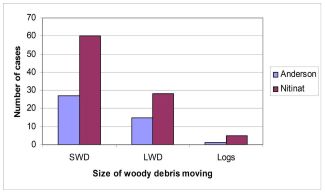
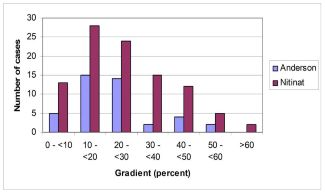
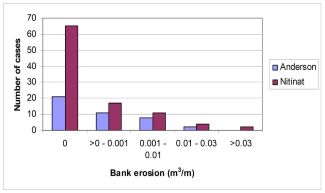
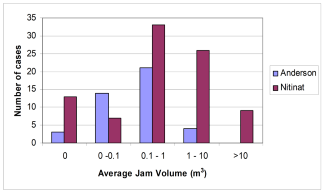
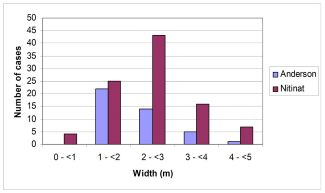
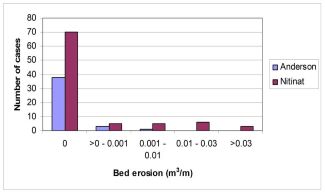
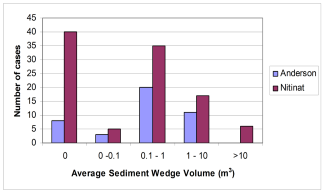
The Nitinat Lake study included 99 stream reaches and the Anderson River study included 42 stream reaches. The graphs below show the characteristics of the streams for each variable included in the studies.
Click on images to enlarge.
Predictors of channel disturbance
Based on the data collected during the studies, the following variables are significant predictors of channel disturbance:
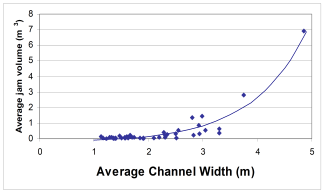
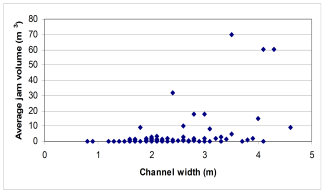
- Channel width, depth, and area; width is best predictor
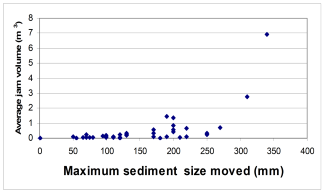
- Size of sediment transported in the stream
| Woody debris size moved | Channel width (m) | |||||
| Anderson | Nitinat | |||||
| Minimum | Median | Maximum | Minimum | Median | Maximum | |
| Small woody debris (SWD) | 1.1 | 1.6 | 2.8 | 0.8 | 2 | 3.3 |
| Large woody debris (LWD) | 2.2 | 2.9 | 5.7 | 1.9 | 3 | 4.6 |
| Logs | 4.9 | 3.1 | 4.1 | 5.8 | ||
Jam volume and width for Anderson
Click on image to enlarge.
Jam volume and width for Nitinat
Click on image to enlarge.
| Woody debris size moved | Sediment size moved (mm) | |||||
| Anderson | Nitinat | |||||
| Minimum | Median | Maximum | Minimum | Median | Maximum | |
| Small woody debris | 1 | 100 | 120 | 2 | 90 | 280 |
| Large woody debris | 110 | 200 | 310 | 45 | 150 | 360 |
| Logs | 340 | 140 | 210 | 360 | ||
Jam volume and sediment size for Anderson
Click on image to enlarge.
Jam volume and sediment size for Nitinat
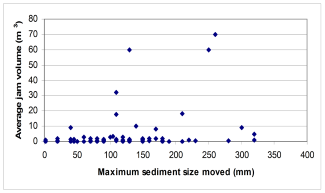
Click on image to enlarge.
What about gradient?
- Gradient has no real effect
- Steeper streams have more channel roughness
- Lower gradient streams are more able to float woody debris
Useful predictors of water transport potential:
- Channel width (could also use channel area, but no better as a predictor)
- Size of sediment moving in channel
- In these two studies, the size of woody debris moving in the channel was used as a response variable, but can also be used as a predictor prior to harvesting
Water transport assessment and cleaning strategies
The research led to recommended cleaning strategies based on water transport potential in streams.
| Water transport potential | Low | Moderate | High |
|---|---|---|---|
| Bank full channel width (m) | ≤ 2 | > 2 to ≤ 3.5 | > 3.5 |
| Size of water transported woody debris | SWD | LWD | Logs |
| Largest sediment transported (mm) | ≤ 100 | > 100 to ≤ 200 | > 200 |
| Water transport potential | Cleaning strategy |
|---|---|
| Low | Do not clean |
| Moderate | Clean all introduced SWD and most LWD |
| High | Clean all logging debris except larger logs |

