Progress to emissions targets
B.C. is working with First Nations, other governments, and many organizations and communities to put CleanBC into action. B.C. is committed to meeting its greenhouse gas (GHG) emissions targets through the accelerated and expanded actions outlined in the CleanBC Roadmap to 2030.
On this page
B.C.’s 2021 GHG emissions
The latest available (1990-2021) GHG emissions data for B.C., as reported in the Provincial Inventory, were 62 million tonnes of carbon dioxide equivalent (MtCO2e). That's down three percent compared to the base year of 2007 and down six percent from 2018 when the CleanBC plan was launched. As expected, emissions began to return to pre-pandemic levels in 2021 as people and businesses returned to normal pre-pandemic routines (commuting, air travel, etc.)–resulting in a one percent increase in gross emissions compared to 2020.
An important consideration when viewing the results is that this reporting period (to December 2021) only covers early actions from the 2018 CleanBC plan. Further emissions reductions are expected as both the number and impact of CleanBC policies continue to grow, and as policies committed to in the CleanBC Roadmap to 2030 (PDF, 9.2MB) are implemented.
Emissions by sector
To help meet provincial GHG targets, in March 2021 the Province established new 2030 sectoral emissions reduction targets for four sectors, with 2007 as the baseline:
- Transportation: 27-32 percent
- Oil and gas: 33-38 percent
- Other industry: 38-43 percent
- Buildings and communities: 59-64 percent
As part of legislated requirements, government will review these targets by December 31, 2025.
Sectoral targets were determined through modelling and are based on the most cost-effective pathways for the Province to reduce emissions across the economy. Read more about the modelling methodology for sectoral targets (PDF, 266KB).
| Sector | 2021 GHG (MtCO2e) | 2021 change from 2007 | GHG categories |
|---|---|---|---|
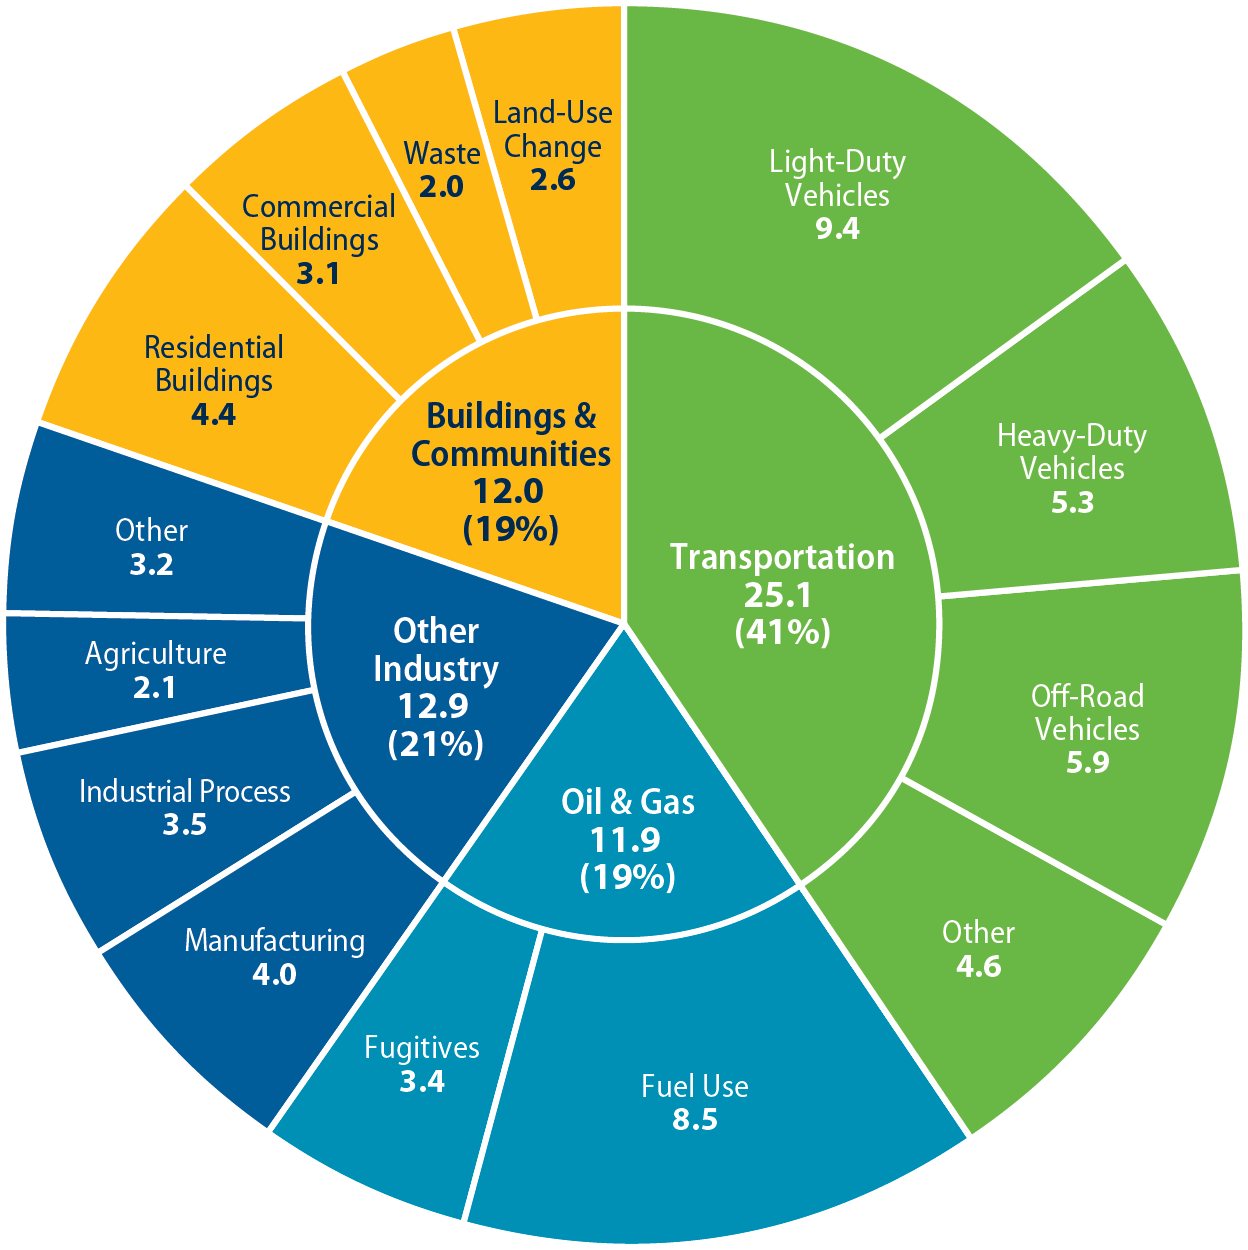
| Transportation | 25.1 | +7.8% | Emissions from on-road light-duty vehicles, on-road heavy-duty vehicles, off-road vehicles and other transportation. |
| Oil and Gas | 11.9 | -12.6% | Emissions from oil and gas extraction, processing and refining as well as transportation emissions from pipelines. |
| Other Industry | 12.9 | -8.0% | Emissions from industries other than oil and gas related to combustion of fuels at industrial facilities, coal fugitives, industrial processes, as well as those from construction and agriculture. |
| Buildings and Communities | 12.0 | -5.9% | Emissions from commercial and institutional buildings, residential buildings, waste, and land-use change such as urban and agricultural expansion (afforestation/deforestation). |
B.C.'s gross GHG emissions by sector and sub-sector in 2021 (62.0MtCO2e total emissions)

Transportation (41 percent of B.C. emissions)
The transportation sector continued to account for the largest share of B.C.’s emissions in 2021. Emissions were five percent higher in 2021 than 2020, led by heavy-duty vehicles (up seven percent), and light-duty vehicles (up four percent). Emissions were almost eight percent higher than in 2007.
Oil and Gas (19 percent of B.C. emissions)
Emissions from the oil and gas sector were down eight percent since 2020, and almost 13 percent from 2007, which can be attributed to declining carbon intensity in natural gas production.
Other Industry (21 percent of B.C. emissions)
Emissions in the industrial sector, excluding oil and gas, were up two percent from the previous year but down eight percent compared to 2007.
Buildings and Communities (19 percent of B.C. emissions)
Emissions from buildings and communities were almost unchanged from 2020, but were down almost six percent from 2007 levels. Reductions were driven by a 25 percent drop in emissions from waste.
Learn more about actions taken in each sector to meet B.C.’s 2030 GHG targets.
B.C. estimates GHG emissions as a range to represent uncertainties in data and modelling. B.C. calculates GHG emissions for future years using the best available data and real-world trends in fuel prices, economic growth, and technological costs.
Information on modelling
Model forecasts in the CleanBC Roadmap to 2030, released in 2021, estimated our commitments would achieve 100 percent of the 2030 target. Since then, accountability reporting has shown variations in progress towards targets. This is primarily due to annual changes in the National Inventory Report and B.C.’s Provincial Inventory, and other updates made to data, assumptions, and inputs in the modelling.
While models can be complex, they can never fully account for all the factors that will shape the future, such as the emergence of new technologies and global shocks like pandemics and wars. Modelling assumptions are updated regularly as new data becomes available and as decisions related to specific CleanBC policies–including measures to protect household affordability and economic competitiveness–are made. Modelled results will therefore change over time.
Additional information on the latest CleanBC modelling can be found in the Provincial Forecast of greenhouse gas emissions. This page will be updated as new modelling scenarios and assumptions are developed. Information on emissions trends and methodology can be found in the Provincial Inventory of greenhouse gas emissions.
Near-term outlook to 2025
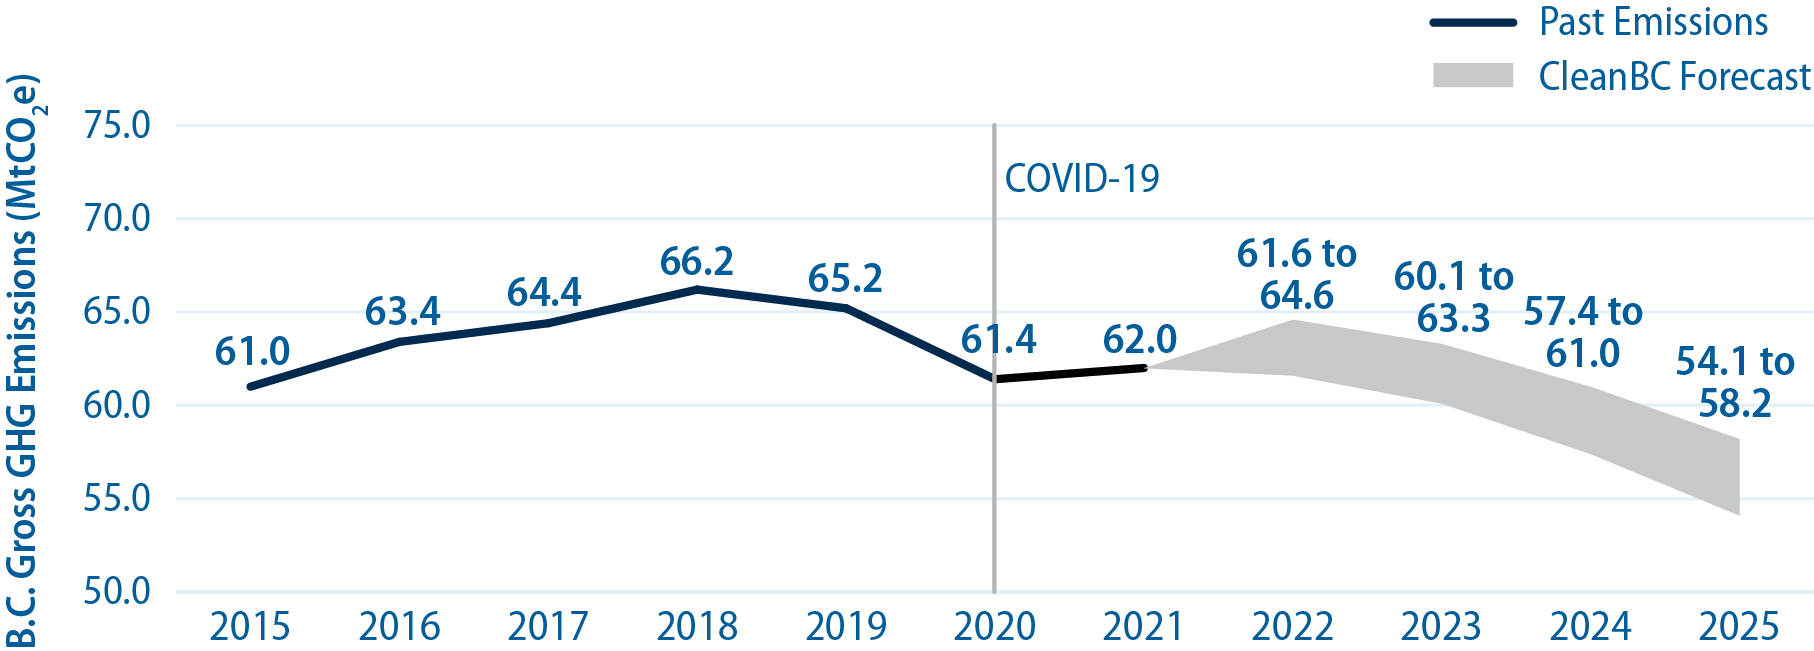
B.C.’s near-term outlook estimates emissions for the four years after the most recently available emissions data up to and including 2025. The outlook suggests that with all CleanBC Roadmap policies fully implemented, emissions can remain below 2007 and 2018 levels and continue to trend downward, despite a likely emissions increase in 2022 following a continued return to pre-COVID-19 levels of economic activity and routines. As both the number and impact of CleanBC policies continue to grow and remaining CleanBC policies are implemented, emissions are projected to follow a downward trajectory to 2025.
GHG emissions forecast from 2022 to 2025
CleanBC projections to 2025 and 2030
Each year we update our model with the most recent data to estimate how close our current and planned CleanBC actions will bring us to our 2030 emissions reduction targets.
This year’s report includes actions from the Roadmap to 2030, announced in 2021, which lays the path to reaching our 2030 climate targets and provides a foundation for achieving net-zero emissions by 2050.
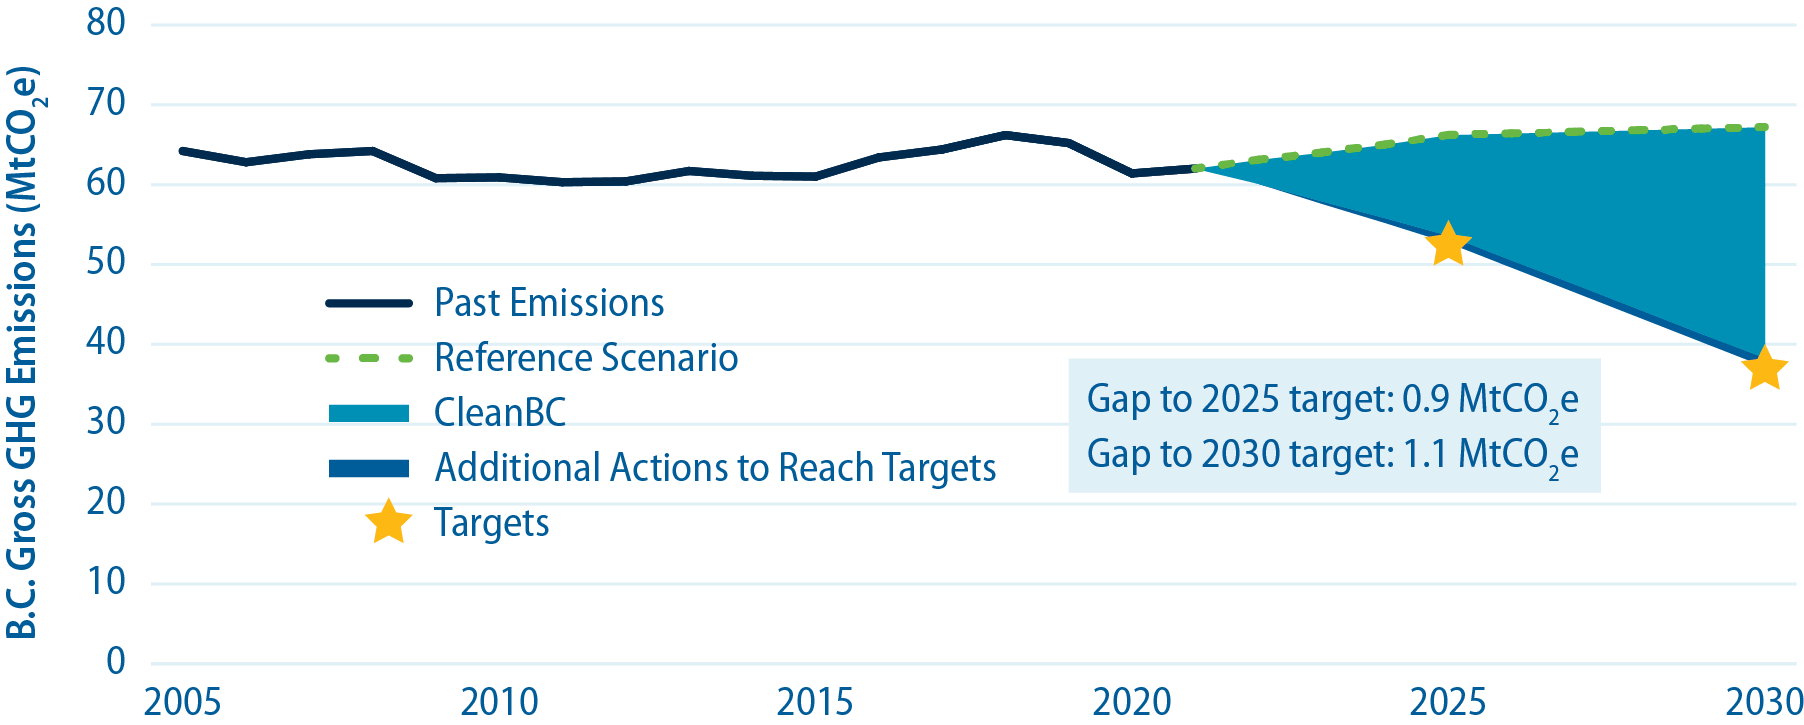
Pathway to meeting B.C.'s 2025 and 2030 targets

Based on current commitments, modelling projections suggest that B.C. could achieve 96 percent of the 2030 GHG reduction target, resulting in a gap of approximately 1.1 MtCO2e. For the 2025 target, the modelling suggests that B.C could achieve 91 percent of the 2025 target if all CleanBC policies and programs are fully implemented (a gap of .9 MtCO2e). The 2025 and 2030 projections represent a significant emissions reduction, as compared to the reference scenario–a scenario in which CleanBC was not implemented.
Government is striving to meet its emissions reduction targets by delivering on the commitments made in the CleanBC Roadmap. This includes a suite of measures that protect medium- and low-income British Columbians from the impacts of rising fossil fuel costs. Additional (or more stringent) actions may be needed for B.C. to reach its 2025 and 2030 targets. Government will closely monitor emissions trends and adjust its climate action measures accordingly.
Climate-related spending
Carbon tax revenues
B.C. first put a price on carbon pollution in 2008. Gradually increasing since then, and required to be aligned with the federal benchmark since 2019, the price on carbon pollution has shifted the behaviour and made less-polluting options relatively cheaper. Maintaining a price on carbon pollution in B.C. remains one of the most effective and economically efficient ways to reduce GHG emissions.
The table below outlines the Province’s total carbon tax revenues and revenue growth for 2021/22 to 2023/24.
To align with federal carbon pricing requirements, B.C.'s carbon tax rates will increase annually by $15 per tonne starting on April 1, 2023, until it reaches $170 per tonne in 2030.
As carbon tax rates increase, B.C. will also increase the amounts paid to adults and children through the climate action tax credit to offset the cost of the carbon tax. These planned enhancements were effective July 1, 2023. The credit is now up to $893.50 for a family of four and up to $447 for a single person. It is anticipated that 80 percent of households will receive a full or partial credit by 2030.
B.C.'s carbon pricing framework also includes measures to protect business competitiveness and jobs, including the B.C. Output Based Pricing System, the CleanBC Industry Fund, and a suite of measures to help small- and medium-sized businesses save money by switching to cleaner, more affordable energy and associated technologies.
| $ Millions | Actual 2021/22 | Actual 2022/23 | Forecast 2023/24 |
|---|---|---|---|
| Carbon tax rate, $ per tonne | 45 | 50 | 65 |
| Total carbon tax revenue | 2,011 | 2,161 | 2,700 |
| Annual revenue growth | 328 | 150 | 539 |
| Revenue growth due to base (i.e., changes to consumption) | 92 | -59 | -104 |
| Revenue growth due to rate increases | 236 | 209 | 643 |
| Revenue growth due to rate increases - Cumulative Totals* | 650 | 859 | 1,502 |
*Cumulative total of incremental carbon tax above $30/tonne since increases started in 2018.
Note: The forecast for 2023/24 assumes implementation of an output-based carbon pricing system for large industrial operations, beginning April 1, 2024.
Climate-related initiatives
Government invested $2.3 billion on climate-related initiatives in the 2022/23 fiscal year and is expected to invest about $2.8 billion in 2023/24.
| Operating investments ($ million) |
Actual 2022/23 | Forecast 2023/24 |
|---|---|---|
| Climate Action Tax Credit | 363.00 | 747.00 |
| Climate preparedness and adaptation | 438.48 | 134.96 |
| Cleaner industry | 233.75 | 208.97 |
| Transit projects | 142.77 | 147.59 |
| Cleaner buildings and communities | 97.24 | 108.51 |
| Cleaner transportation | 116.70 | 90.87 |
| Other tax measures | 54.93 | 89.00 |
| Cleaner government and public sector | 13.16 | 13.38 |
| Other climate spending | 379.67 | 70.10 |
| Total | 1,839.70 | 1,610.38 |
| Capital investments ($ million) |
Actual 2022/23 | Forecast 2023/24 |
| Transit projects | 377.00 | 1,105.00 |
| Clean government and public sector | 55.60 | 81.72 |
| Cleaner transportation | 18.88 | 13.00 |
| Total | 451.48 | 1,199.72 |
| Grand total (operating and capital) | 2,291.18 | 2,810.10 |
Notes:
- Amounts in each year are not cumulative and totals may not add due to rounding. Amounts are not audited. The list may not capture all climate-related spending by government and this presentation may expand in subsequent reports
- CleanBC operating and capital spending are broken down by sector
- Other tax measures include: PST Exemption on used zero-emission vehicles, e-bikes, and heat pumps, among others. Some exemptions (for example, PST) are largely point-of-sale exemptions–they can only be estimated, unlike expenditures provided through other taxes
- Other climate spending includes all other operating investments such as the BC Indigenous Clean Energy Initiative; CleanBC Plastics Action Fund; Community Energy Diesel Reduction Program; and the Indigenous Food Affordability and Food Security Initiative

