Regulatory Reform Policy
The Regulatory Reform Policy guides the development and improvement of provincial legislation, regulations, policies and forms. Its intent is to make sure that all requirements are necessary and that their impacts on people or businesses are identified and addressed without compromising public health, safety and the environment. The main mechanism for this analysis and tracking is the Regulatory Impact Checklist or the Regulatory Impact Checklist Exemption Form.
Regulatory Requirements Count
A regulatory requirement is any action or step that must be taken to access services, carry out business, or meet legal responsibilities under provincial legislation, regulation, policy, or forms, as detailed in B.C.'s How We Count Guide.
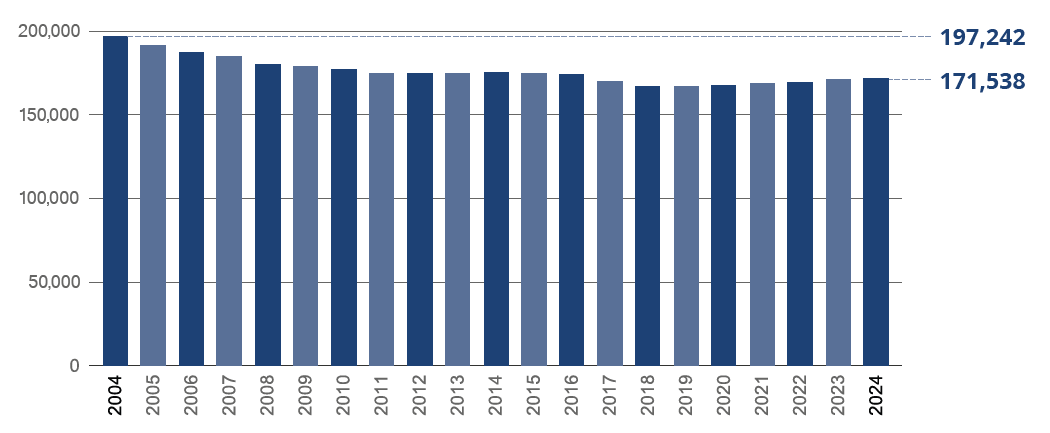
B.C. has tracked the number of regulatory requirements since 2001 and reports updates annually.
B.C.'s Regulatory Requirements Count*

To provide a more meaningful assessment of the relevance of regulatory requirements on British Columbians, relative measures have been added to the annual report; these measures reflect the number of regulatory requirements compared with three indicators:
- Gross Domestic Product (GDP)
- Population
- Number of businesses
Assessing the number of regulatory requirements against these indicators allows for a greater understanding of how requirements change over time relative to the areas where requirements have the most impact.
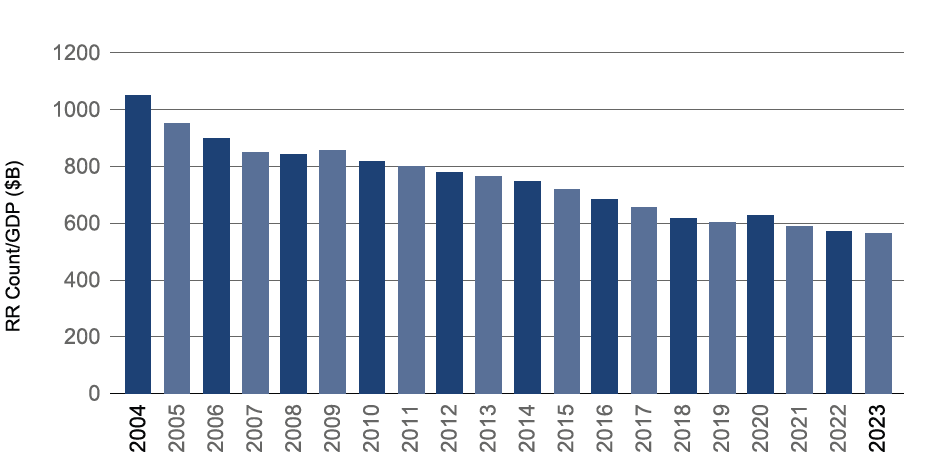
Economy-based (GDP Count Ratio)*
Regulation influences economic activity and production of goods and services in B.C. Examining the ratio of regulatory requirements relative to economic output of the province – measured by Gross Domestic Product (GDP) – provides awareness of the impact of regulation on economic performance.
The ratio of regulatory requirements relative to GDP has been on a downward trend since 2004. Over the last ten years (since 2013), provincial GDP has expanded by 32 per cent, while the number of regulatory requirements decreased 3 per cent.

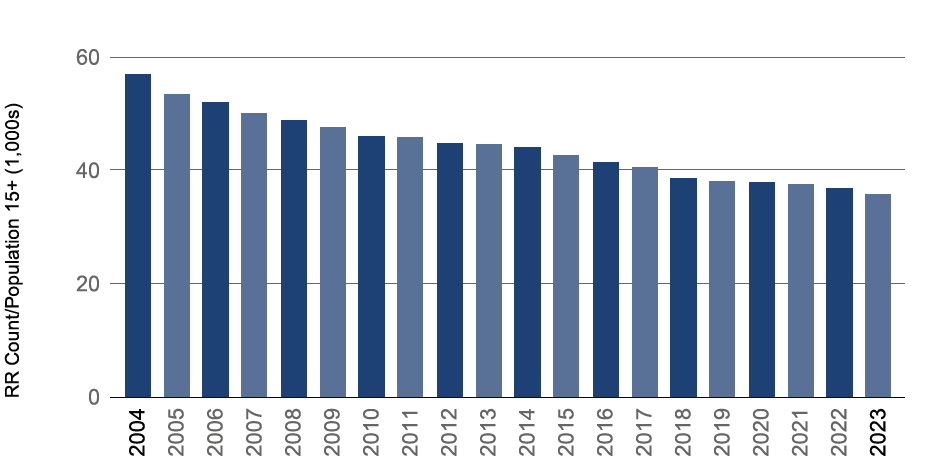
People-based (Population Count Ratio)*
Regulations are relevant and beneficial to all people living in B.C. Looking at the number of regulatory requirements relative to working-age population in B.C. provides insight on the potential for regulatory impact on workers.
The ratio of regulatory requirements relative to population (aged 15 and over) has been on a downward trend since 2004. Over the last ten years (since 2013), population has increased by 21 per cent, while regulatory requirements decreased 3 per cent.

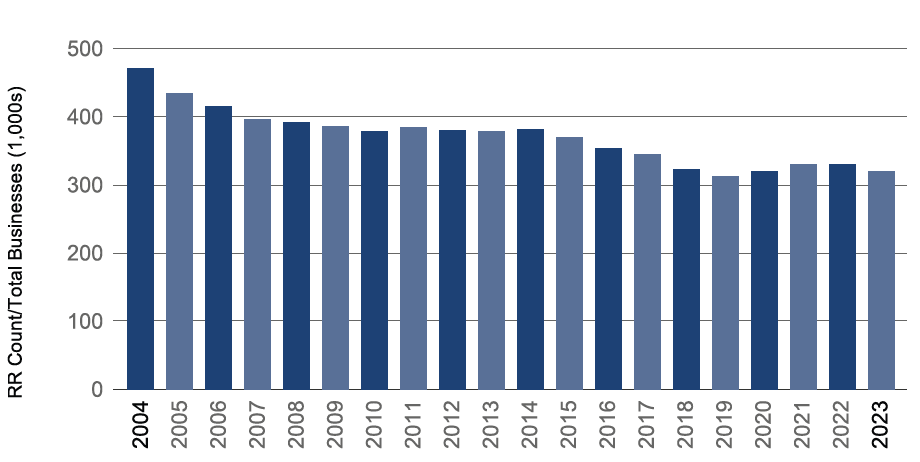
Business-based (Business Count Ratio)*
A strong and growing business environment is essential for B.C.’s economy. The regulatory environment supports business and economic growth, in particular because B.C.s business ecosystem is oriented to smallness. Approximately 58 per cent of B.C. businesses are owned and operated by someone who is self-employed without paid help. Of the approximately 200,000 businesses in the Province with employees, 57 per cent have fewer than five employees and 96 per cent have less than 50 employees.
The ratio of regulatory requirements relative to business count has been on a downward trend since 2004. Over the last ten years (since 2013), the total number of businesses in B.C. has increased by 15 per cent, while the number of regulatory requirements decreased 3 per cent.

*Please note that the Regulatory Requirements Count graph is by fiscal year and the ratio graphs are by calendar year.
Resources
The Policy Approaches Playbook supports new and experienced analysts in understanding the most common policy approaches. It provides a framework to assist policy teams in selecting the most appropriate instrument for their particular circumstances.
We work at all stages of policy development to keep B.C.'s regulations and policies modern and inclusive.
Have an idea of how B.C.'s regulations could be updated? Submit feedback to the email below.
Email:
BetterRegulations@gov.bc.ca
