Downloading Analytics Data
Last reviewed: October 20, 2022
You have options for downloading dashboards, reports, and data:
Dashboards as PDFs
You can download the dashboard in a PDF format. This may be useful for reporting or sharing purposes.
Download a dashboard in PDF format:
- Click the three vertical dots icon in the upper right of the dashboard

- Select "Download"
- Select "PDF"

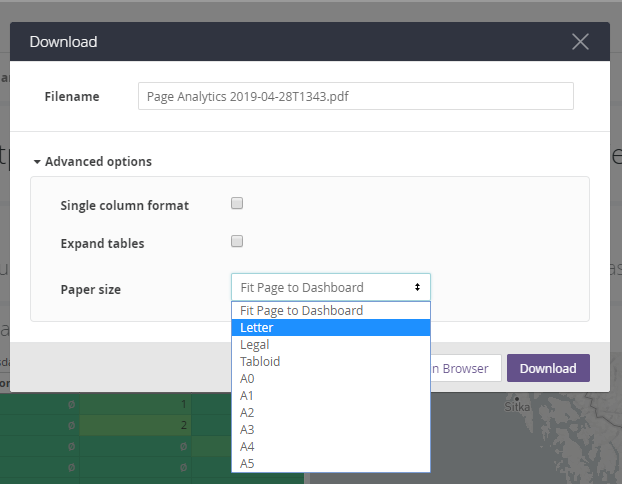
- (Optional) Change the Filename as needed
- (Optional) Select one or more Advanced options:
- Choose a button:
- Click the Open in Browser button to preview the dashboard OR
- Click the Download button to save the report to your computer or network
- Wait for the dashboard to generate
- Experiment with the settings to find which ones work best for your needs
Data as CSVs
You can download the data used to generate the reports of the dashboard as an archive of CSV files for analysis.
Download an archive of CSVs:
- Click the three vertical dots icon in the upper right of the dashboard

- Select "Download". A standard Save As window opens
- Select "CSV"
- Select where you want to save the archive
- (Optional) Change the File name as needed
- Click the Save button
- Extract the files to use the data in whatever application you choose
Individual Reports
You can download the data for an individual report (section) of the dashboard in many formats.
Download data from an individual report:
- Hover over the report you want to download data from
- Click the three vertical dots
- Select "Download Data ..."
- Choose your options (see the Looker downloading page for details on each option)
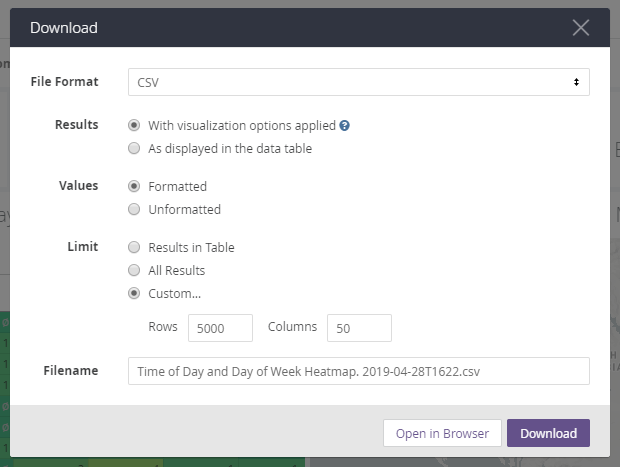
- (Optional) Change the Filename to one more useful to you
- Choose a button
- Click the Open in Browser button to preview the data
- Click the Download button to save the report to your computer or network
- Wait for the dashboard to generate. This may take a moment
- Experiment with the settings to find which ones work best for your needs
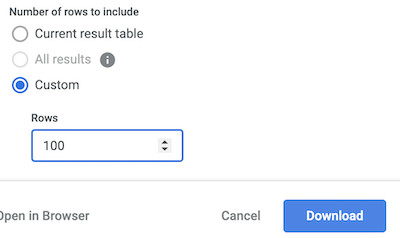
Downloading or Viewing More Rows of Data
For tiles with multiple rows of data, you may want to see more than the default number listed:
- For example, in the Top Pages tile, you want to view the top 100 results
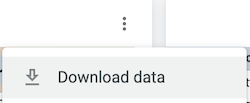
- To do this, hover over the top right hand corner of the tile, so the 3 dots appear. Click on this icon.
- Select Download data.
From this new menu, select Advanced data options.
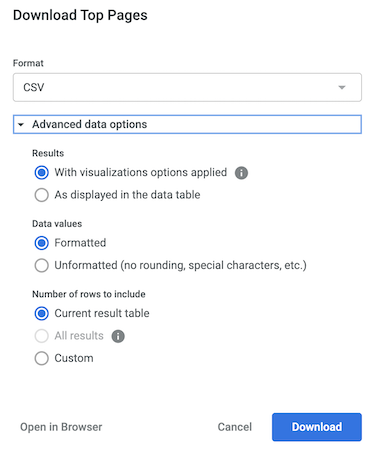
The last step is to select Custom beneath Number of rows to include.
- Then, input 100 as we want the top 100 results
- Click Download to finish
Contact information
For information on ordering GDX Analytics services:
- Learn about GDX Analytics services (IDIR Restricted)
- Submit a request through the GDX Service Desk forms
- Email: GDX.ServiceDesk@gov.bc.ca

