Lesson 6 - Introduction to Field Indicators - Part 2
Objective
This lesson covers the basics of continuous indicators and other indicators collected during the field assessments. The protocol and field guide are an important resource. You should never go to the field without having these with you (uploaded to your iPad or a hard copy).
Field Sampling Data Collection - Continuous and Other Indicators
In this lesson you will understand:
- The difference between Continuous and Other Indicators;
- How to identify and measure these attributes as you walk the sample reach; and
- Where to record the information you collect, and how to use it to answer the evaluation questions.
NOTE: This training course provides an overview of key indicators. It is not a replacement for the protocol, field guide and field training. This section attempts to clarify some of the indicators that FREPers can struggle with when doing the assessments on their own.
Continuous Indicators: Overview
In this section of the course, refer to the protocol for details to each indicator. This course only covers a few examples for clarification purposes.
Continuous indicators are measured or estimated over the entire length of the reach. Depending upon the channel morphology or stream type, there are various observations assessors will be collecting along the reach, both in the channel and in the riparian area beside the stream.
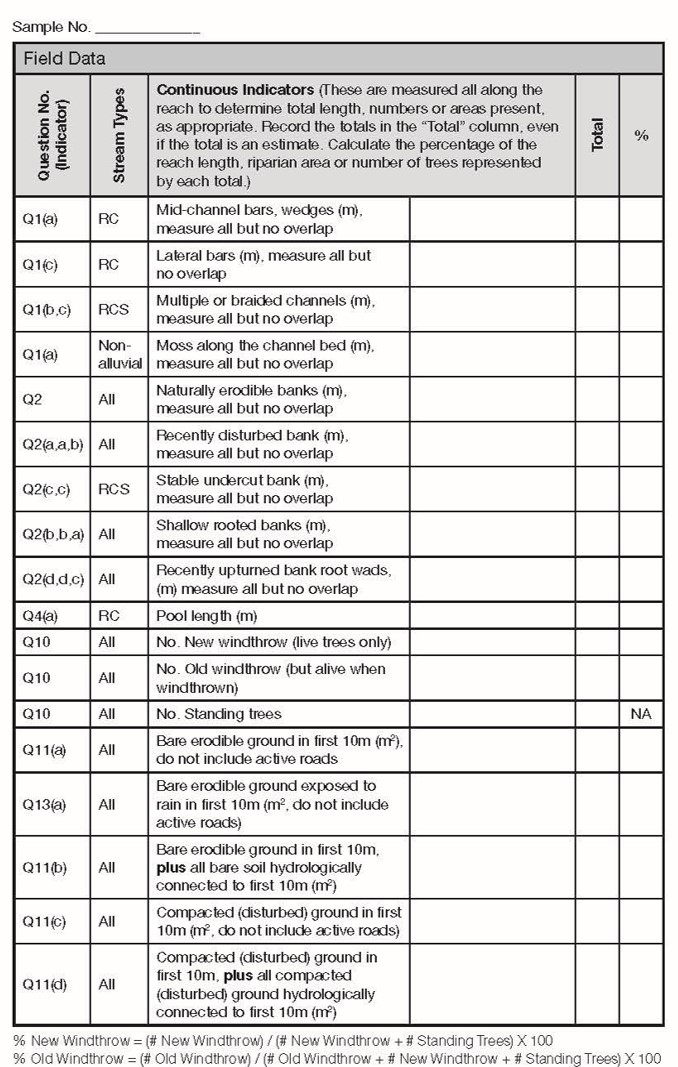
Refer to page 3 of the checklist. You will see that for each indicator there is a reference to the relevant functioning condition question (1st or left column) AND the stream type/morphology (2nd column). Note that not all continuous indicators are a feature for all stream types. If the stream type states RC, then for riffle and cascade pool stream, look for this indicator. If the stream type states RCS, then for riffle, cascade and step pool streams, look for this indicator. If the stream type is non-alluvial, then look for this indicator. Finally, if the stream type is ALL, then for all stream types you will look for this information.
To collect the continuous indicators there at least two ways to accomplish this for efficiency. One technique is to assign a person to walk the whole reach measuring 1-3 different but related indicators from start to finish. Each person on the team covers off a different set of indicators, recording their observations on a blank field sheet and then transferring their information onto page 3 of the checklist. The advantage to this system is that each person gets proficient at identifying and measuring their suite of indicators, increasingly getting more proficient as they progress along the stream.
Alternatively, a person can measure 1-3 different but related indicators but focusing on one sampling segment at a time and recording their observations on page 3 of the checklist. Then each person switches indicators for the next segment, thereby gaining practice in looking for and measuring all indicators. An advantage of breaking the work into 5 segments is that people will be recording 5 sets of numbers corresponding to each segment. If there is a discrepancy about the information, you can investigate the segment suspected to be incorrect.
How to Collect "Recently Disturbed Bank" Continuous Indicator
Click on this link to watch a video on measuring the length of recently disturbed bank
In this video, it is demonstrated how to measure one of the continuous indicators: length of recently disturbed bank. Note that the measurements are slope distance. Alternatives to using a tape would be to use a range finder device (for features longer than 5m), pace or visually estimate. If you estimate, it is a good idea to periodically calibrate your accuracy – visually estimate a feature’s length and then measure it to ensure you are relatively accurate.
QUESTION: How would you recognize signs of recently disturbed banks?
ANSWER: You will need to consider several different features to recognize recent disturbance, such as:
- Sloughing banks with active ravelling
- Unvegetated bank is angled back away from the stream
- The surface of the bank has not oxidized, nor has moss colonized the surface
- Visually see exposed fine, fleshy roots from bank anchoring vegetation
- Cattle disturbed/collapsed banks
- Rutted banks
- Banks buried by sediment and/or LWD accumulations
- Calving banks materials
How to Collect "Length of Sediment Deposits" Continuous Indicator
Click on this link to watch a video on measuring length of sediment deposits
In this video, it is demonstrated how to measure the length of sediment deposits. Alternatives to using a tape would be to pace or visually estimate. If you estimate, it is a good idea to periodically calibrate your accuracy when encountering longer sediment deposits – visually estimate a feature’s length and then measure it to ensure you are relatively accurate.
Question: How do you distinguish between a Mid-Channel Bar and a Lateral Bar?
Answer: The distinguishing features between a Mid-Channel Bar and a Lateral Bar are:
- Lateral bars are deposits immediately adjacent to and parallel to the bank; they gradually sort from coarse to fine when viewed from deep channel to bank; easiest to observe are opposite the undercutting bank on a bend in the stream; and there is a gradual slope upwards towards the bank.
- Mid-channel bars are deposits; can be associated with obstacles (sediment wedges); usually not anchored to the banks (mid-channel bar); they have a concave shape.
Continuous Indicator: Windthrow
During the walk along the stream, assessors need to be aware of windthrow. The premise for this indicator of the RREE process is to consider live tree retention as an investment to future riparian function (e.g., shade, LWD supply, habitat). If you see evidence that there is wind damage to the dominant and co-dominant trees originating within the riparian reserve zone (S1-S3), or the riparian management zone for streams without a RRZ (S4-S6) then we will need to measure and compare the level of recent windthrow to pre-harvest levels (old windthrow levels). This assessment is looking at the CHANGE in levels of windthrow.
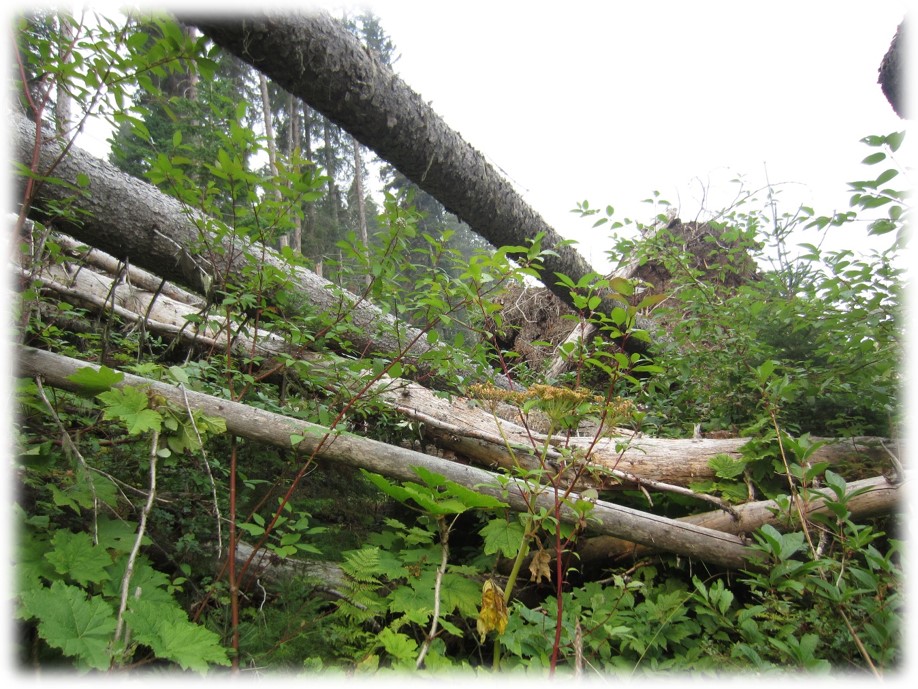
There are a few fundamental conventions:
- Do not consider the loss of dead trees as windthrow.
- Only count windthrow or standing trees that grew in the assessment area.
- Do not count trees or windthrow that fell into the assessment area.
- Live trees within the assessment area that snapped off at the stem are included as windthrow.
Recent windthrow is any windthrow to dominant or co-dominant live trees that happened during or after the treatment you are assessing. Recent windthrow are the trees which have been tipped (lodged into other trees), upturned or their tops have snapped. The word “recent” is the same as “new” or “post-treatment.”
Old windthrow is windthrow that occurred before the treatment you are assessing but is still recognizable as windthrow. To be considered old windthrow as opposed to “ancient” windthrow, the windthrow should still have a root wad (major lateral roots present).
How do you decide if a downed tree is OLD windthrow or RECENT? This can take time to investigate. Look for the presence of fungal conks on the logs and count the number of growth rings on the conk and compare this to the date of logging. Consider the age of vegetation growing on the root wad and compare to the date of logging. If a downed tree has conks which have changed their orientation on the stem, this is a good clue the tree was likely dead prior to the wind event and should be disregarded. The integrity of branches, bark, stems and roots can also help to decide whether the fallen tree is recent (solid and intact) or old (decayed, loose and shedding).
NOTE: If the RMA requirements are different than the default RMZ requirements, we assess to the default standards for consistency in reporting out on a provincial scale. However, please make a note on page 18 of the ‘different’ standards for subsequent reference to effectiveness of the prescribed practices and possible feedback to enabling continuous improvement.
Continuous Indicator: Riparian Zone Structure and Health
Fundamentally, we need the 10m riparian zone to be a source of trees, habitat, recruitment of LWD, provider of shade and perform the role of rain/snow interception both now and in the future.
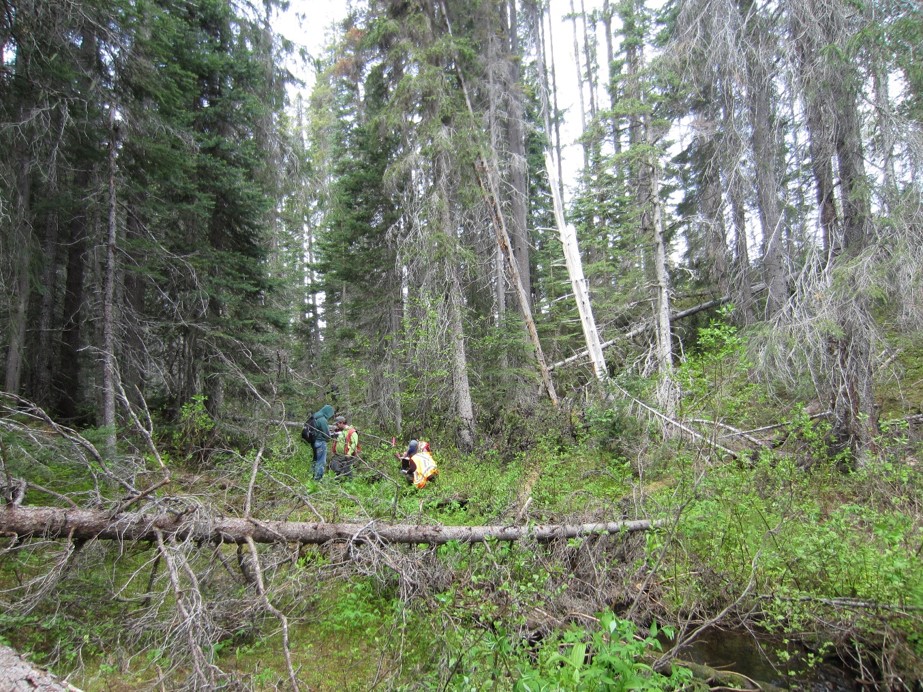
Compare the riparian zone to what an undisturbed mature/climax plant community would look like for the area in which you are working. Use checklist tables to answer Q15a and Q15b. Where structural components are naturally absent, record NA for both Q15a and Q15b for these elements. In second growth logged sites and/or developing stands post fire, these are challenging to describe. Remember to compare to the natural, pre-disturbance state.
For help with Q15a, remember that if a component is completely missing or 100% over-represented, record zero. For example, a clearcut has no dominant and co-dominant trees (score 0 for overstory) but is a continuous gap (scores 0). Similarly, if a fire scorches the overstory and they are all dead, then there is an over-abundance of snags (score 0 for snags) and no living overstory (scores 0).
If the elements are ‘developing’ then score these at 50%. Consider SNAGS. In a thrifty, overstocked stand, there are many understory trees which have died from suppression. However, since they have minimal habitat value, snags chould be scored 50% - present but small and not long-standing.
Remember to look for historical evidence of old trees in second growth. A 30-40year old stand has a long way to go before seeing overstory trees, snags and CWD as big as what the natural, unmanaged forest had prior to logging.
For help with Q15b, remember to look at the form, vigour and evidence of recruitment of each component. As an example, if there has been more than 75% of the overstory cut out of this 10m riparian zone but understory was left intact, then the overstory layer is of poor form (stumps are not tall trees) and rated NO; and poor vigor (stumps are dead trees) and rated NO but if there are tall understory trees, these are recruitment sources of overstory trees and scores YES. In this example there is a similar negative effect to the arboreal moss and arboreal lichens because the removal of the overstory removed these elements.
Continuous Indicator: Deeply Rooted Banks
Along the stream, watch for signs of deeply rooted banks. If the banks alongside a stream are deeply rooted, they can withstand water erosion, and typically develop a stable undercut appearance during bank erosion processes.
To count as deeply rooted, you should see a diversity of deep-rooted plants (e.g., trees, shrubs, reeds, rushes, ferns, native deep-rooted grasses) growing within 1m of the stream’s banks. Measure wherever you observe BOTH banks to be simultaneously deeply rooted. Conversely, if only a small section is shallow-rooted, this can be measured instead, but then you will need to subtract from the total ERODIBLE reach length to answer question 2b with respect to deeply-rooted banks. Note that the extent of a plant’s structurally deep anchoring roots is to its crown’s dripline.
The concept is that we want to see DIVERSITY of deeply rooted species along the banks. If there are mainly trees, but no or little cover by shrubs, then the banks are often not very resilient to bank erosion.
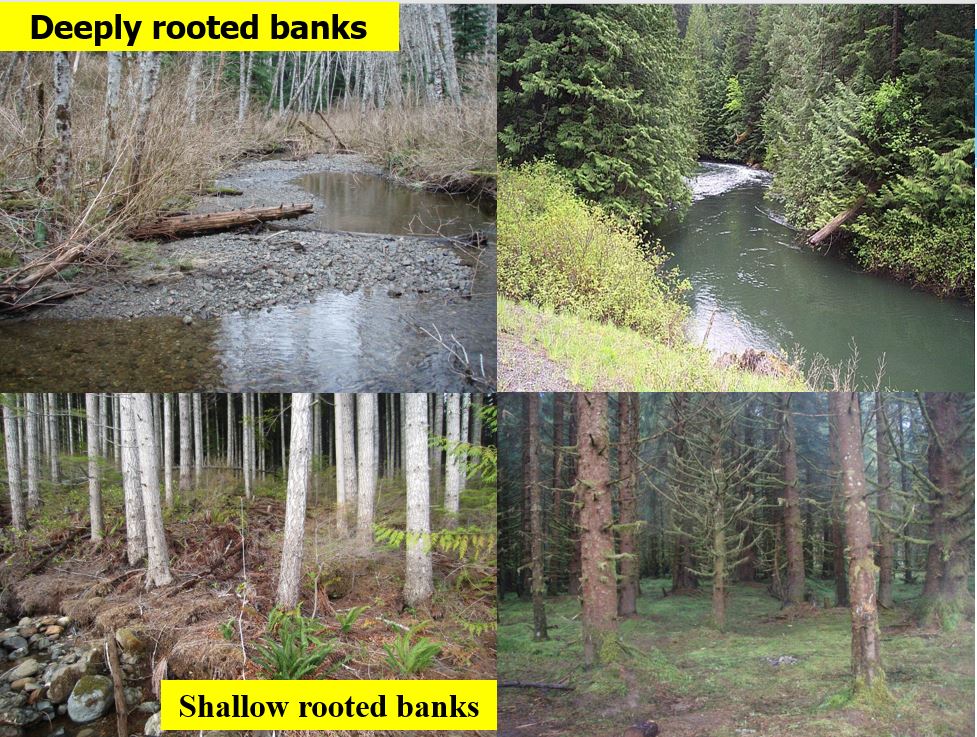
The top left and right photos are examples of DEEPLY rooted banks where there is overlapping rooting afforded by both overstory trees and understory shrubs. The bottom left and right photos are examples of SHALLOW rooted banks, measured to be the banks between the butts of the trees.
NOTE: the banks of over-stocked second growth stands are often weakly anchored; you may see shrubs, but they appear scrawny from expending more energy to persisting than to anchoring beneath the shaded overstory.
Continuous Indicator: Bare erodible ground
While walking the riparian area of a stream, look for signs of bare erodible ground which are a sediment delivery source. Any exposed soil patch (not flood deposited sediment) within 10m of a stream bank will be measured as a sediment source. This often includes windthrow, cattle trails, sloughs and deactivated roads. Measure the gross area of each patch and estimate the %fines (materials <2mm). A root wad measuring 2m x 3m has 6m2 of surface area, but if 50% is partially vegetated and has cover by needles and coarse stones, then discount by 50% (or 3m2) to represent bare erodible fines.
Hydrologically linked bare soil: fine sediment can also be transported into the 10m riparian zone, and then make its way into the stream. Therefore, we must watch out for signs of sediment delivery external to the riparian zone, such as from a landslide or a road crossing located immediately above your reach or from an active road that parallels the stream. If you see obvious signs of sediment delivery (trail of mobilized fines or rilling) into the stream or riparian zone, then estimate the area of bare soil areas (net down to just the fines AND then % connected) and consider these as ‘hydrologically linked’ and recorded in indicator Q11b. This process could take time and a sketch map of the features and their dimension is a useful aid.
NOTE: If you see signs that a stream has flooded and deposited sediment onto the 10m riparian zone, this is NOT tallied as Bare Erodible Ground. This is a deposit of filtered fines rather than exposed soil (one of the functions of an intact and connected riparian zone is to filter out mobile sediments).
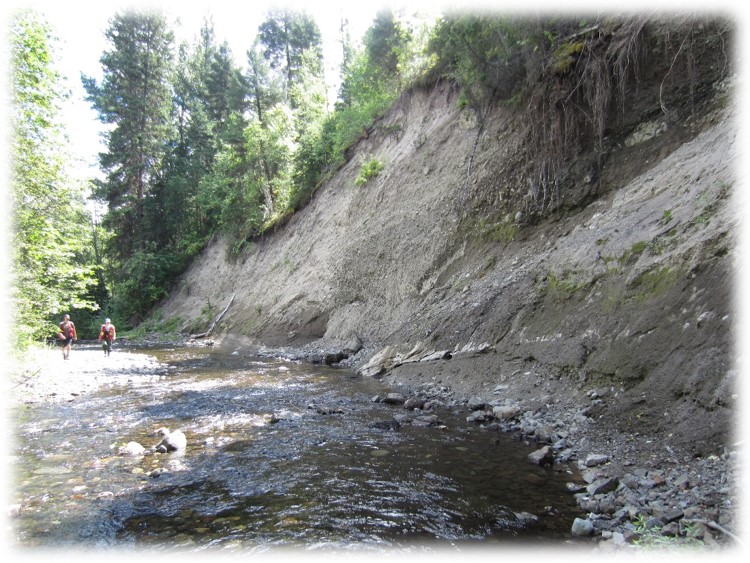
Above Photo: Actively erodible mass wasting is a common sediment source. In this image, there are bare soils within the 1st 10m on the right, and then hydrologically connected bare soils from above this 10m zone.
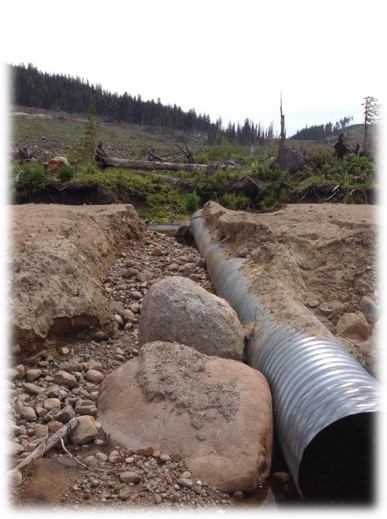
Above Photo: A road actively delivering fine sediment to the stream. The bare soil associated with the road is tallied as being HYDROLOGICALLY linked to the stream (the road has not been deactivated – in this case a washout).
Continuous Indicator: Compacted Ground
Soil that is compacted does not allow rainfall water to percolate into the soils, nor does it allow plants to develop deep rooting. Therefore, we must watch out for signs of compacted ground (e.g., roads, trails, cattle pugging) and measure these areas. If they are found within the 10m riparian zone then enter the area into indicator Q11c, and into indicator Q11d if compacted area is upslope but there is obvious hydrologic linkage to the stream or riparian zone.
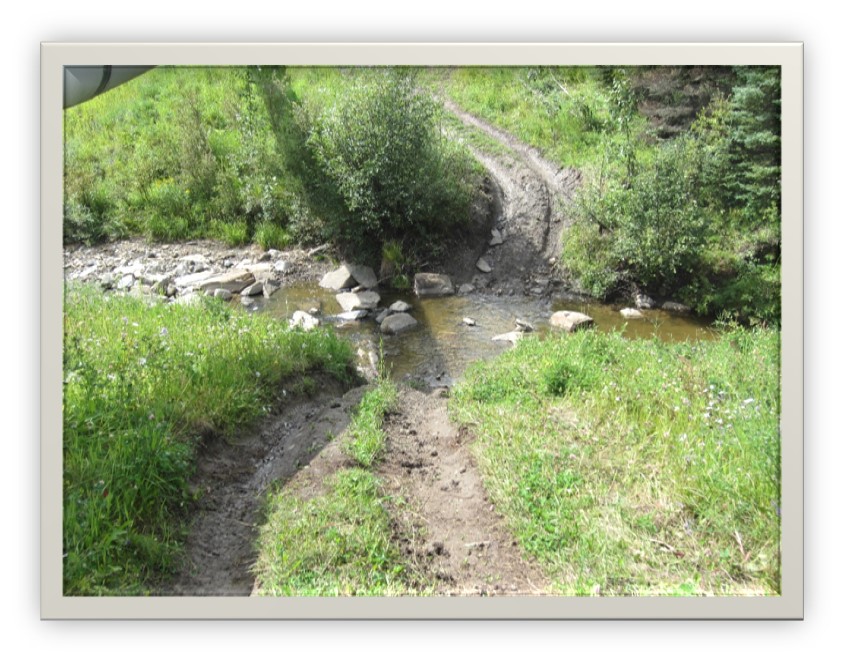
Above Photo: An ATV trail is actively shedding water (and sediment) to the stream. The compacted wheel tracks on this trail is tallied as being HYDROLOGICALLY linked to the stream from outside the 10m riparian zone, and also as compacted ground for the tracks within the 10m riparian zone.
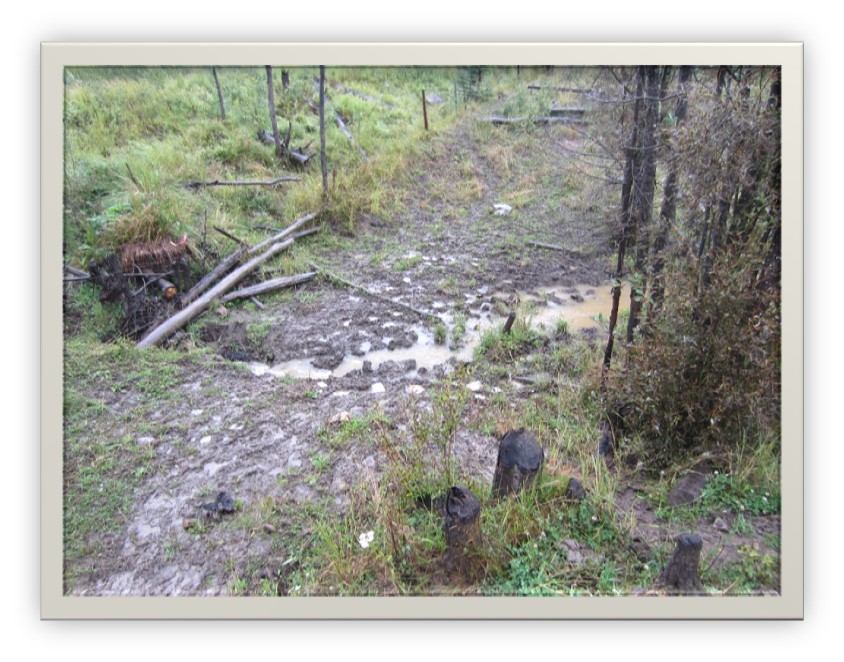
Above Photo: Example of cattle damage to the riparian zone. In this image, there is compacted (pugged ground) within the 1st 10m, and then hydrologically connected compacted ground associated with the cattle trail leading down into the 10m zone.
Other Indicators to Note: Overview
During the walk along the stream, be aware of and observe signs of impairment. Knowing what you are to look for will take some practice, but the more you practice performing the RREE assessment the easier this becomes. To help with this process, it is advisable to refer to the “Other Indicators to Note” section of the checklist before starting to walk the reach, and again after you have finished laying out the sampling transects; figure out what you observed and could answer without further attention, and what will require some devoted time to review.
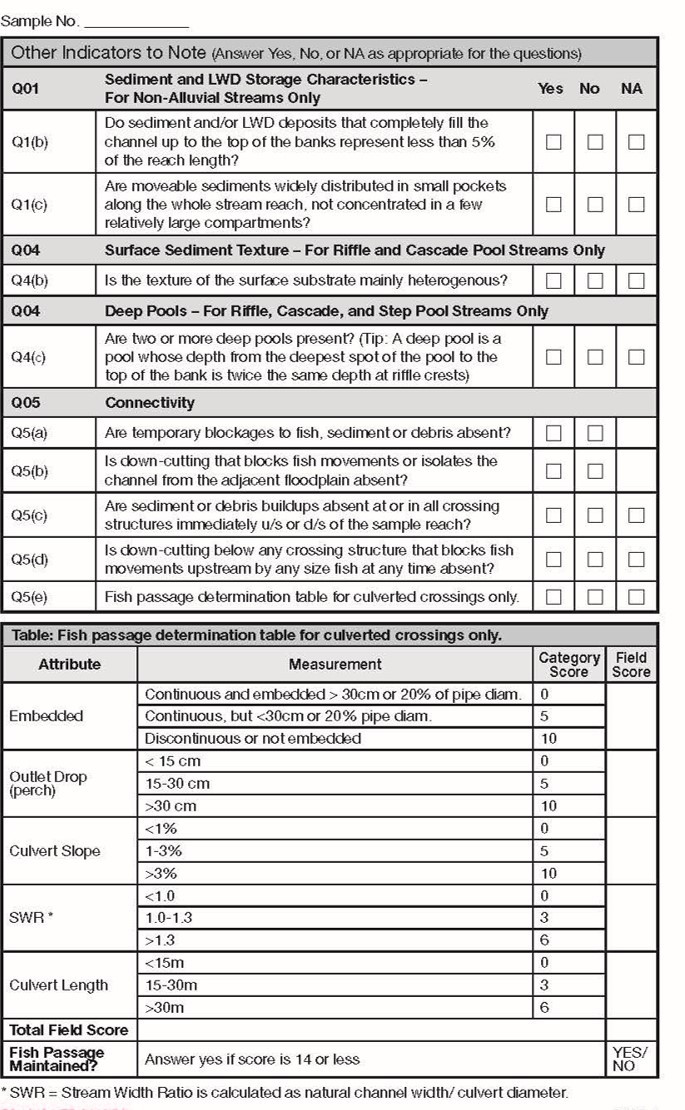
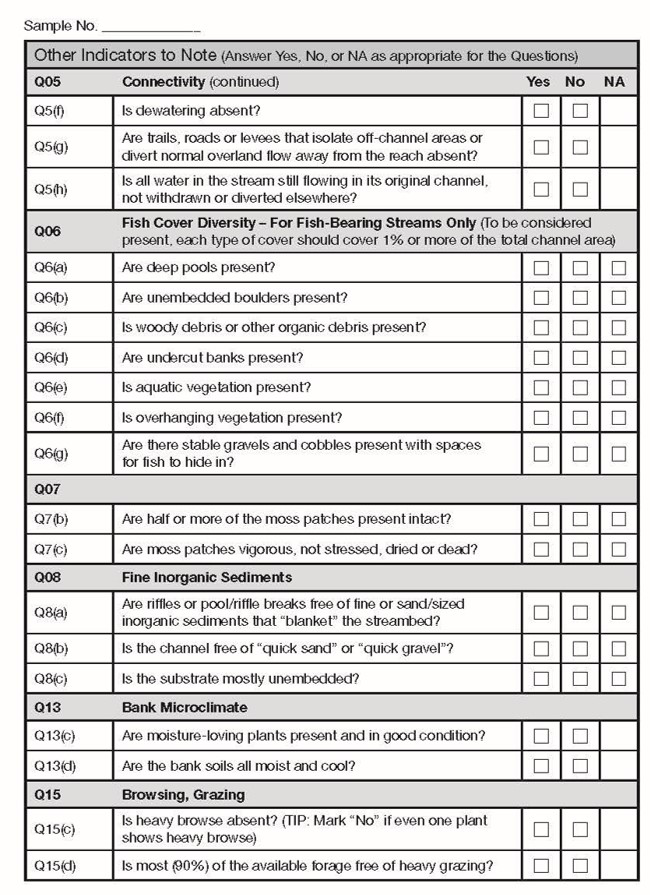
In this section of the course, refer to the protocol for details to each indicator. See Checklist pages 4-5. This course only covers a few examples for clarification purposes.
Other Indicators to Note: Fine Sediments
There are a few indicators we use to describe the level of fine sediment in a stream. If you notice the channel bed at a riffle is blanketed by fines (like spilling a sack of flower on the floor of your kitchen) then roughly measure the size of this blanketed spot and compare it to the channel area. Mark NO to this indicator in Q8a if this blanketed area is more than 1% of the channel area.
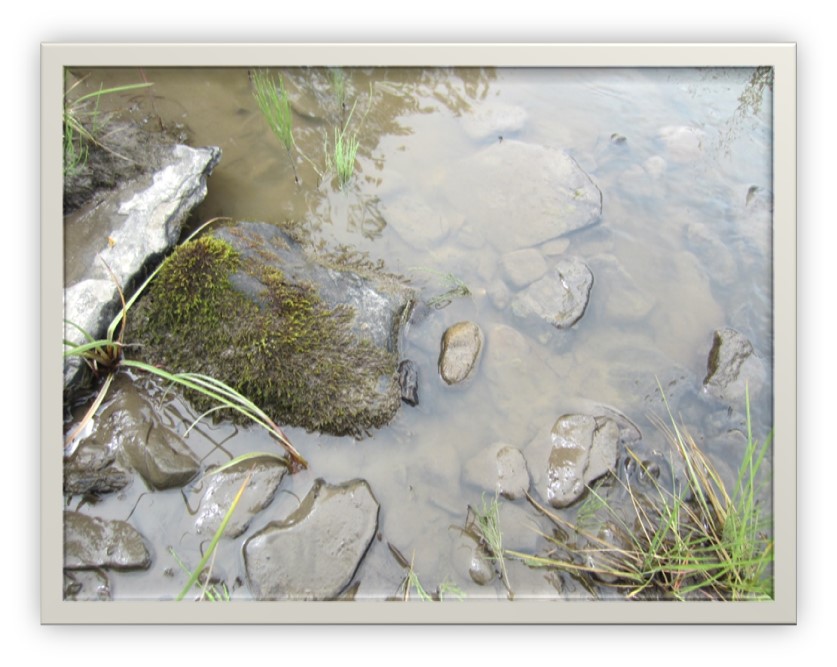
If you observe quick-sand or quick-gravel accumulations, then roughly measure the size of this accumulation and compare it to the channel area. Mark NO to this indicator in Q8b if this accumulation is more than 1% of the channel area.
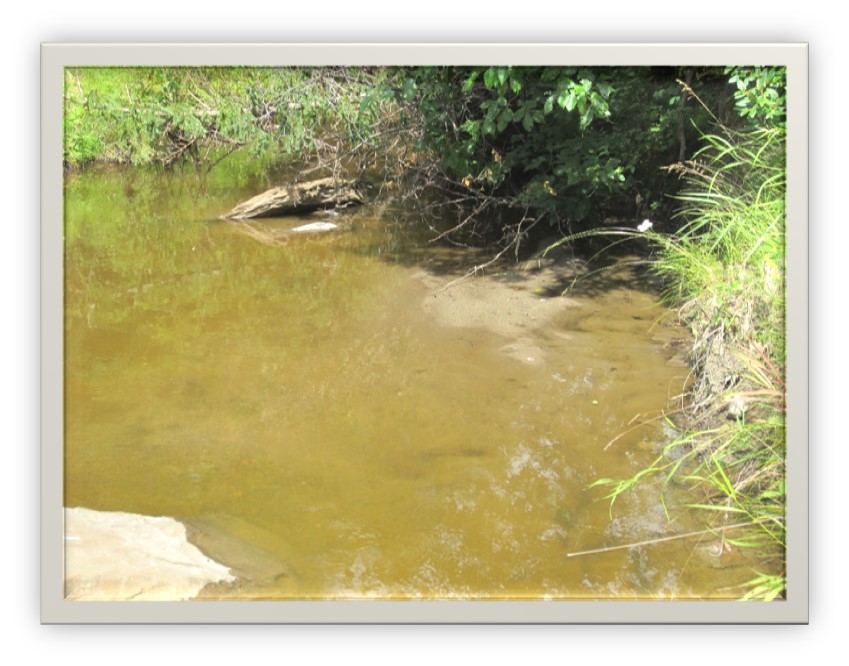
We will also look at the average coverage of fines measured in the riffles as a ‘point indicator’ and if there is, on average, more than 10% fines in the riffles then mark NO to this indicator in Q8a.
NOTE: There are some stream systems where the parent materials are naturally all fine textured (e.g., glaciofluvial and glaciolacustrine materials). In this situation, if there are no obvious road or landslide sources of sediment delivery, the indicator Q8a can be recorded as N/A. However, you must not be too quick to default to N/A – check the cut profile of the channel banks to see if they are fine textured or compare to a reach outside the block. If you observe gravels and cobbles, then N/A would not be appropriate.
Field Sampling Self-Check Questions
Answer either True or False to check your understanding:
1. You have an S6 stream with a 40m timbered buffer (called a Wildlife Tree Patch reserve) along the logging edge and there is windthrow. You will measure the old and new windthrow within the entire retention patch.
2. You arrived at a stream reach below a road and notice there is a collapsing bridge with obvious sediment delivery. You will measure the hydrologically connected road for erodible fines (Q11b) and compacted ground (Q11d).
Answers
1: False – The S6 stream has a RMZ of 20m, so the area of focus for windthrow determination will only be the 20m adjacent to the stream.
2: True – The evidence of hydrologically connected sediment delivery means that sediment sources and compacted ground associated with the road must be measured to help answer Q11. If a Water Quality Evaluation was done at the crossing, use the data collected for this measurement.
Field Sampling Self-Check Questions (continued)
Answer either True or False to check your understanding:
3. Channel banks which have lost or lack deeply rooted vegetation are always considered disturbed banks.
4. All windthrown trees which fell across and span the stream should also be called LWD because it will eventually decay and fall into the channel.
5. If the transect lands at a pool feature we must move our point indicator sampling to the nearest riffle for fines, moss and benthic invertebrates; or we can record N/A if there are no accessible riffles.
Answers
3: False – While shallow rooted banks are likely to erode, you MUST see evidence of RECENT erosion on the face of the bank.
4: False – LWD must be in part or wholly in the channel; so windthrown trees/branches have to be partly in the channel before we can consider it as functioning LWD at the time of the visit (even though we know it will eventually settle into the stream).
5: True – we sample for moss, fines and benthic invertebrates in the riffles only. If there is no riffle within this segment of the stream, then record N/A for these indicators at this transect point.
Congratulations! 
You have now completed the Riparian / Streams online training!

