Regional Geochemical Survey
The most current and complete province-wide geochemical data set collected under the Regional Geochemical Survey (RGS) program.
This data set was generated by integrating RGS data previously published by the British Geological Survey and Geoscience BC. It was compiled from 116 original sources with 65,000 samples and about 5 million determinations analyzed using 18 methods in 18 laboratories. For the ease of use and consistency with previously published data, the data set is in a flat tabular format. Behind the scenes is the newly developed RGS database that operates through a semi-automated process for data compilation, quality control, upload, and product generation. This RGS database provides a solution for consistent, standardized, and long-term data storage and for timely data update and regular data release. The RGS data set is just one of many potential data products that can be generated from the RGS database.
Regional Geochemical Survey (RGS) data update

T. Han and A.S. Rukhlov
The Regional Geochemical Survey (RGS) database stores and manages geochemical data collected by the British Columbia Geological Survey (BCGS), the Geological Survey of Canada (GSC), and Geoscience BC. It includes data from drainage waters, fluvial deposits such as heavy mineral concentrates (HMC) and moss-mat sediments, lacustrine deposits, and vegetation such as spruce twigs and needles. Herein we augment data released in 2017 (GeoFile 2017- 11) with new information from BCGS and Geoscience BC sources published between 2016 and 2019. The new data include 656 samples with ca. 70,000 determinations analyzed by 12 analytical methods in seven laboratories.
Recommended citation: Han, T. and Rukhlov, A.S., 2020. Update of the provincial Regional Geochemical Survey (RGS) database at the British Columbia Geological Survey. British Columbia Ministry of Energy, Mines and Petroleum Resources, British Columbia Geological Survey GeoFile 2020-08, 3p.
The current version is downloadable here.
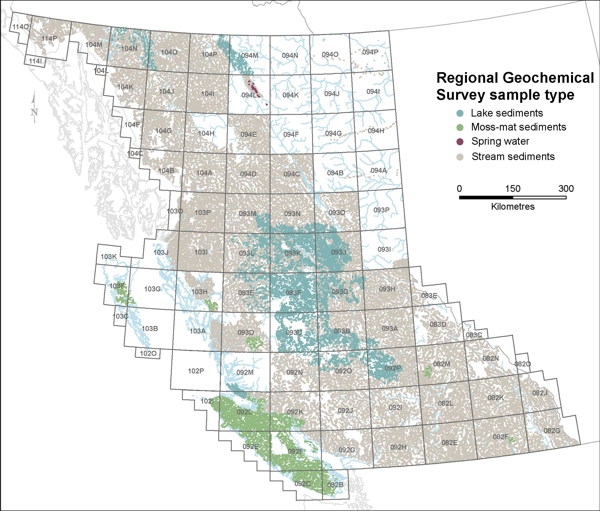
Regional Geochemical Survey sample distribution

Previous versions:
- Han, T., and Rukhlov, A.S., 2017. Regional Geochemical Survey (RGS) data update and release using the newly developed RGS database. British Columbia Ministry of Energy and Mines, British Columbia Geological Survey GeoFile 2017-11.
- Rukhlov, A. and Naziri, M., 2015. Regional Geochemical Database 2015. British Columbia Ministry of Energy and Mines, British Columbia Geological Survey GeoFile 2015-03.
Additional information:
Catchment Basins
Meaningful techniques for presenting geochemical data from regional stream sediment surveys have long been a difficulty for explorationists. Contouring and image analysis methods can create artifacts which misrepresent the data whereas its display as point values may not portray the spatial variation inherent to the data set.
Further, the geochemistry of a stream sediment sample is often most influenced by the geology of the sediment source area. Coding the sample site by its underlying geology may not accurately represent the site and may result in the misidentification of anomalies.
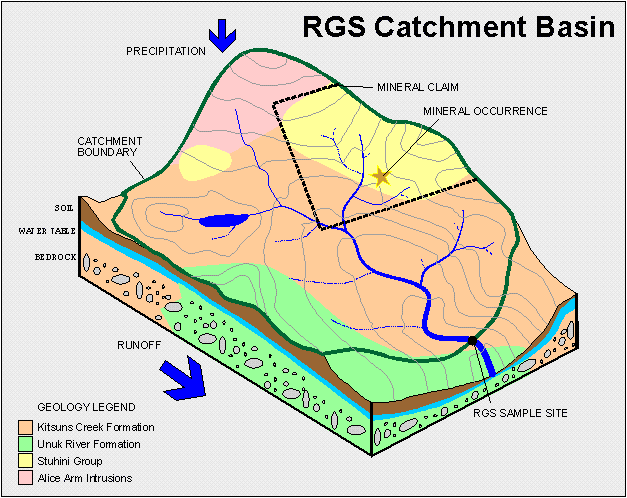
An effective solution to this problem is to utilize the catchment basin of each sample site to define its zone of influence. This method can be used to:
- Define the actual areal coverage of a survey
- Reclassify the geological influence on each sample based on its source area
- Redefine the thresholds which separate anomalous from background populations
Consequently, the BC Geological Survey has instituted a program of capturing catchment basin data for new and previous RGS areas. Each catchment basin map is produced from 1:50 000 scale topographic maps. Catchment basins are defined by the topographic height of land which divided one drainage from another.

The resulting polygons are digitized with each polygon labeled to correspond to its RGS sample number. On occasion, nested polygons are produced where two samples were taken from successive sites on the same stream; in these cases the downstream polygon is defined to end at the upstream sample site. Areas of each polygon are calculated during the digitizing procedure. The corresponding RGS data can then be joined to each digital polygon record for interpretation.
Examples of catchment basin studies, interpreting RGS data:
D.C. Arne and E.B. Bluemel, ioGlobal Solutions, Inc., 2011. Catchment Analysis and Interpretation of Stream Sediment Data from QUEST-South, British Columbia, Geoscience BC Report 2011-05.
Cui, Y., 2010. Regional Geochemical Survey: Validation and Refitting of Stream Sample Locations. In: Geological Fieldwork 2010. British Columbia Ministry of Energy and Mines, British Columbia Geological Survey, Paper 2011-12, pp. 169-180.
Cui, Y., 2010. QUEST South Regional Geochemical Survey: Catchment Basins for 2009 Stream Sample Sites. British Columbia Ministry of Energy and Mines, British Columbia Geological Survey GeoFile 2010-14, 4 p.
Cui, Y., Eckstrand, H. and Lett, R.E., 2009. Regional Geochemistry Survey: Delineation of Catchment Basins for Sample Sites in British Columbia. In. Geological Fieldwork 2008. British Columbia Ministry of Energy, Mines and Petroleum Resources, British Columbia Geological Survey Paper 2009-1, pp. 231-239.
Matysek, P. and Jackaman, W., 1995. B.C. Regional Geochemical Survey Anomaly Recognition, an Example Using Catchment Basin Analysis (103I, 103J). In: Geological Fieldwork 1995, British Columbia Ministry of Energy, Mines and Petroleum Resources, British Columbia Geological Survey Paper 1996-1, pp. 185-190.
Sibbick, S.J. 1994. Preliminary Report on the Application of Catchment Basin Analysis to Regional Geochemical Survey Data, Northern Vancouver Island (NTS 92L/03,04,05 and 06). In: Grant, B. and Newell, J.M., (Eds), Geological Fieldwork 1993. British Columbia Ministry of Energy, Mines and Petroleum Resources, British Columbia Geological Survey Paper 1994-1, pp. 111-117.
Sibbick, S.J. and Laurus, K.A., 1995. Integrated Geological and Geochemical Map for the Prediction of Intrusion-related Mineralization, Northern Vancouver Island. British Columbia Ministry of Energy, Mines and Petroleum Resources, British Columbia Geological Survey Open File 1995-12, 1:250,000 scale.
