MapPlace 1
MapPlace 1 is the original web service that allows clients to browse, visualize, and analyze multidisciplinary geoscience data. This service is scheduled to be retired in the near future. MapPlace 2 is now available and has the most up to date data available.
Update November 2019: MapPlace 1 has limited functionality or may not work. The platform has not been supported by MapGuide since 2004, therefore due to compatibility issues with current servers this service is being retired in the near future. MapPlace 2 is available here.
Main Maps | Geology Map Indexes | Detailed Geology Maps | Geophysical Maps | Mineral Activity and Potential Maps | Oil, Gas and Coal Maps | Miscellaneous Maps
Getting Started, Help and Resources
Main Maps
|
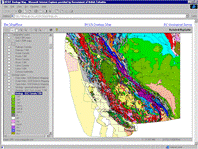
This map, in BC Albers Projection, has all the datasets and expanded geology layers. The Legend Window to the left of the map is organized into Layer Groups. Look for the expanded geology, mineral occurrence, ARIS and mineral title layers at the bottom of the legend window. Administrative layers are at the top. Topographic layers, including TRIM, are in the middle of the legend window. Two sets of Level 1 Mineral Resource Assessment layers are available, a shaded version above the geology layers and a solid version below the geology layers. Level 2 MRA for metallic mineral potential is also available. Map codes were recently rationalized and new updated sedimentary, volcanic, metamorphic, intrusive and ultramafic geology layers were added. Lithologies are displayed and reported by age and rock type. Geology is compiled at a 1:250K scale. Compilation scales may be shown with the legend label; scales in brackets, e.g. (<1:1.2M) or (<300K), are the scales, shown in the lower right part of the map, at which the layer is visible. This map is also available as UTM Projected Maps. |
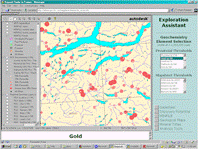
This map features 8 Analysis Tools to display information based on query selections. Use the Location/Gazetteer to search, display and Zoom Goto Indian Reserves, Latitude - Longitude Coordinates, Mapsheet, Municipality, Place Name, Scale, or UTM Coordinate. The Discovery Potential tool displays where deposit types are likely found (based on the Mineral Resource Assessment program). Search and display MINFILE by commodity, deposit type, name, Mining Division or NTS Map. Display Geology by age, lithology and terrain. Search and display Mineral Titles by Name, Owner ID, Anniversary Date, and Acquired Date. The Geochemistry Element section features the selection of 38 elements, from the Regional Geochemical Survey program, for display as Provincial or Mapsheet thresholds; symbols can also be resized. The Search Publications section features searches, on the GSB publications, by Author, Title, Keyword, Abstract, Year, Scale, Series, Publication ID, Map Extent and All Fields. Image Analysis Toolbox (IAT) is a framework to add, process and display a variety of multi and hyperspectral imagery. The Layer Finder helps locate any of the over 500 layers using keywords.
Note: Please note that Exploration Assistant will not work with Internet Explorer 10. Please see MapPlace 1 FAQ 2 for more details
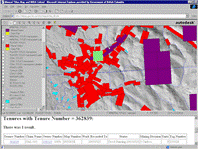
Legacy MiDA Mineral, Placer and Coal tenures (before January 12, 2005) and Mineral and Placer Mineral Titles Online (MTO) tenures (after January 12, 2005) are displayed on this map. Crown granted two post claims are available in raster format for downloading or viewing. To access these maps turn on the Crown Grant Download theme and double click on the map area of interest. The page that appears in the lower frame will give you the option to download one of the two possible half sheets for use in some graphics program OR to view the maps interactively and integrated with other MapPlace information.
When you select the interactive viewing a new window will appear with the Crown Grant raster data displayed and other information can then be added. This map is in UTM83 projection so caution must be exercised as one nears the UTM zone boundary. A Mineral Titles Archive group is available with March 2000 and May 2001 data. The Mineral Titles Online grid is available below 1:60K scale, with labels at 1:20K scale.
NOTE: MTO Titles information provided to MapPlace is current to the previous day
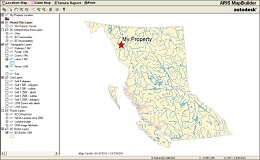
The ARIS MapBuilder can be used to quickly produce maps to partially fulfill assessment reporting requirements. Property location maps, claim maps, and tenure reports can be generated. The ARIS MapBuilder also creates a .kml file to show claims in viewers such as Google Earth.
View BC UTM Map Zone 7
View BC UTM Map Zone 8
View BC UTM Map Zone 9
View BC UTM Map Zone 10
View BC UTM Map Zone 11
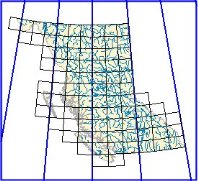
These maps display BC, projected for each of the five UTM zones in the province. UTM zone projections are useful for viewing smaller areas at medium to large scales, and for obtaining UTM coordinates. They are not useful for displaying the entire province because there are large distortions in shape, area and direction outside of the intended zone. These maps include most of the data from the BCGS map. They benefit from more thorough orthophoto coverage, and more recent Landsat imagery. The UTM Zone maps also link to the other zone maps through the right-click pop-up menu.
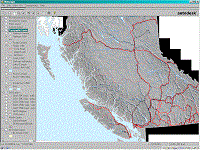
This map is useful for viewing base map layers in BC. It features Administrative, First Nations, Parks, with links to descriptions by BC Parks, Forestry, Topographic, Aquifers, Water Wells, Environment Canada Climate Stations, with links to station details, and Grid layers. It also has the LandSat and DEM Image Hillshade Raster layers. This map contains minimal geoscience data layers, including only mineral occurrences, bedrock geology, mineral resource assessment, volcanoes and earthquakes. To view more comprehensive geoscience data, see the BCGS Geoscience Map. The elevation points (at 1:200K scale) and elevation labels (at 1:100K scale) are now available in the 1:20K Features (TRIM) group.
Geology Map Indexes

*Please use MapPlace 2 for the most up to date data
This map displays footprints for BC Geological Survey (BCGS) Publications. These include coverages for Bedrock maps, MINFILE publications, Regional Geochemical Surveys and Surficial Mapping. Many of the footprints are linked directly (double-click) to the online reports or indirectly through tabular reports (select footprints, reports). See also GSC & GSB Geology Map Indexes.
A new publication is available for the Surficial Geology Map Index: Open File 2019-03.

View GSC & GSB Geology Map Indexes
*Please use MapPlace 2 for the most up to date data
Displays Geological Survey of Canada (GSC) and B.C. Geological Survey (GSB) map indexes on a map of the World, zoomed into Canada. Volcanoes are available on this map. See also BC Geology Map Index.
Detailed Geology Maps
Interactive Map for GeoFile 2008-11: Terrace Preliminary Geodata Release
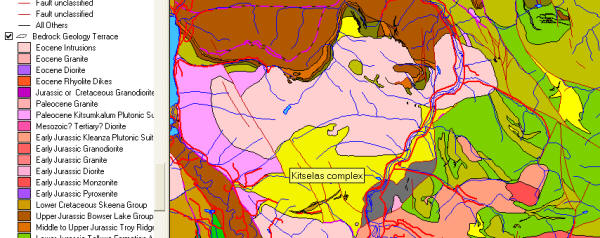
This map shows the geology and mineral deposits of the Terrace area of West Central British Columbia. This map was produced by a partnership between the BC Geological Survey and the Terrace Economic Development Authority. Other components include GIS files for download and KML/KMZ files for use in Google Earth.
The Terrace geodata release presents for the first time in digital form the geology and mineral deposit potential of the Terrace area of northwestern British Columbia. It provides an easy-to-use introduction to the geology and exploration potential of the area. This release presents results of the ongoing Terrace Geological Mapping and Mineral Assessment Project which is now in its third year with publication of three 1:50,000 geological maps. This data release gives direct access to the digital files and geoscience data generated during the project.
View Nechako NATMAP Project map
Interactive Map for BCGS Open File 2007-10 / GSC Open File 5623: A Digital Suite of Geoscience Information for Central British Columbia
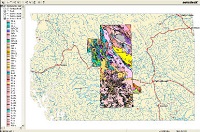
This map shows the geology and mineral deposits of Central British Columbia. This map was produced by the NATMAP Project in conjunction with the Geological Survey of Canada. Other components include GIS files for download (See Open File 2007-10).
Open File 2007-10, a collection of digital geoscience information, was produced by members of the Geological Survey of Canada (GSC), British Columbia Geological Survey (BCGS), universities and industry under the auspices of the Geological Survey of Canada's National Mapping Program (NATMAP) as the Nechako Project (1995-2000). The information consists of geoscience data sets for all or parts of six 1:250,000 scale NTS map sheets located in central British Columbia: Manson River (093N), Fort Fraser (093K), Nechako River (093F), Prince George (093G/W), Smithers (093L/9,16), and Hazelton (093M/1,2,7,8).

View Skeena Arch Geology and Mineral Deposits map
This map, in Universal Transverse Mercator projection, shows the geology and mineral deposits of the Skeena Arch area of West Central British Columbia. This map, funded by Geoscience BC and delivered by D.G. MacIntyre and Associates Ltd., is one of the components of BCGS GeoFile 2007-03/Geoscience BC Report 2007-5. Other components include GIS files for download.
The Skeena Arch is a northeast trending belt of uplifted Jurassic and older rocks that transects central British Columbia. This uplift is believed to have formed in the Middle Jurassic and resulted in separation of the Bowser and Nechako basins. Rocks exposed along the Skeena Arch represent a long lived magmatic arc that has produced a diverse range of mineral deposits in a wide variety of geologic settings. This area represents some of the most richly endowed terrain in British Columbia and has been the site of mineral exploration for the past 125 years.
The information contained within the Skeena Arch map is organized in such a way as to highlight the mineral resource potential of this important metallogenic belt. Users can select layer groups for a number of different deposits types that are found along the trend of the arch. The information that was compiled to build the Skeena Arch map comes from a digital geology compilation done by the BCGS (Massey et al., 2005). Datasets from this compilation and other sources have been reduced by restricting the data to the extent of the project area. This area includes all of the Hazelton (093M), Smithers (093L) and Whitesail (093E), the south half of the McConnell Creek (094D), east half of the Terrace (103I) and southeast corner of the Nass River (103P) map sheets.
The Legend Window is organized into themes. Administrative layers are at the top, followed by mineral occurrence, ARIS, RGS and mineral title layers. Landuse planning and topographic layers, including TRIM, are in the middle of the legend window. Below these are a series of metallogenic layer groups designed to highlight the distribution and exploration potential for a number of key deposits types such as Porphyry Cu, Porphyry Mo, Eskay Creek type VMS and Epithermal Au-Ag. Each layer group contains MINFILE, RGS and geology layers that are relevant to the particular deposit type. Below the metallogenic layer groups are the regional geology layers follow at the bottom of the legend window by various raster layers (LandSat, DEM and Aeromagnetics).
Topographic layers are also arranged into layer groups. The information displayed when a layer group, for example rivers, is turned on will depend on the scale that the map is zoomed in to. Below a zoom scale of 1:100,000 topographic layers are mainly from TRIM (Terrain Resource Information Management). These layers include Transport Structures, Rail, Roads, Rivers, Lakes, Land Cover and Contours.
Downloadable Datasets
A key objective of the Skeena Arch project was to generate a series of GIS compatible data files that could be downloaded and incorporated into standard GIS software packages. Below is a list of the files currently available. The files are available as ESRI shape files because this format can be used in almost all commercially available GIS packages including ESRI’s free Arc Explorer. Two projections are currently available – UTM and Geographic. Also included for download is a Manifold GIS Map file that contains all of the layers used to build the Skeena Arch metallogenic map. Manifold also supports the creation of KML (Google Earth) files for specific layers and a number of these have been generated for the Skeena Arch project area.
References:
Massey, N.W.D., MacIntyre, D.G. and Desjardins, P.J. (2003): Digital Geology Map of British Columbia: Tile NN9 North Coast, B.C. Ministry of Energy and Mines, GeoFile 2003-13, scale 1:250,000.
Massey, N.W.D., MacIntyre, D.G., and Desjardins, P.J. (2003a): Digital Geology Map of British Columbia: Tile NO9 North Central B.C., B.C. Ministry of Energy and Mines, GeoFile 2003-18, scale 1:250,000.
MacIntyre, D.G. (2006): Geology and Mineral Resources of the Skeena Arch, West-Central British Columbia: A Geoscience BC Digital Data Compilation Project (parts of NTS 093E, L, M, 094D, 103I and 103P), in Geological Fieldwork 2005, B.C. Ministry of Energy, Mines and Petroleum Resources, Paper 2006-1, pages 303-312.
MacIntyre, D.G. (2007): Geology and Mineral Resources of the Skeena Arch, West-Central British Columbia/Parts of NTS 093E, L, M; 094D; 103I, P): Update on Geoscience BC Digital Data Compilation Project. in Geological Fieldwork 2005, B.C. Ministry of Energy, Mines and Petroleum Resources, Paper 2007-1, pages 333-340.
Contacts and Notes:

View Belt-Purcell Geology and Metallogenic map
This map, in Universal Transverse Mercator projection, shows the geology and mineral deposits of the Belt-Purcell Basin area of Southeast British Columbia. This map was built by D.G. MacIntyre and Associates Ltd. on contract to Natural Resources Canada as part of a Targeted Geoscience Initiative (TGI-3) program, covering the Belt Purcell Basin and Kootenay Arc regions of southeastern B.C. This map is one of the components of BCGS GeoFile 2007-02. Other components include GIS files for download.
As described by Trygve Höy, the Belt-Purcell basin is a Middle Proterozoic intracratonic basin with an early synrift fill succession, represented by the Prichard Formation in the U.S. and Aldridge Formation in Canada. The Aldridge and Prichard formations are dominated by deep-water turbidites that contain numerous mafic sills and a variety of base metal deposits including the massive to stratiform Sullivan Sedex deposit (MINFILE 082FNE052).
The information contained within the Belt-Purcell map is organized in such a way as to highlight the mineral resource potential of this important metallogenic belt. This has been done by creating separate layer groups containing information relevant to the exploration for specific deposit types, such as the economically important Sedex deposits. The geological layers that are part of the Belt-Purcell map were created by converting Geoscience Map 1995-1, a regional compilation map in AutoCad drawing format published by the B.C. Geological Survey Branch in 1995 (Höy et al., 1995), to ESRI shape file format. Additional detailed geology around the Sullivan deposit was added from Geoscience Map 2004-1 which covers the St. Mary’s map sheet (Höy and Jackaman, 2004). The area included in the Belt-Purcell compilation covers map sheets 082G, 082F, 082E and parts of 082J and 082K.
The Legend Window is organized into themes. Administrative layers are at the top, followed by mineral occurrence, ARIS, RGS and mineral title layers. Landuse planning and topographic layers, including TRIM, are in the middle of the legend window. Below these are a series of metallogenic layer groups designed to highlight the distribution and exploration potential for a number of key deposits types such as Sedex deposits that are hosted by the Middle Proterozoic Aldridge Formation. Each layer group contains MINFILE, RGS and geology layers that are relevant to the particular deposit type. Below the metallogenic layer groups are the regional geology layers follow at the bottom of the legend window by various raster layers (LandSat, DEM and Aeromagnetics).
Topographic layers are also arranged into layer groups. The information displayed when a layer group, for example rivers, is turned on will depend on the scale that the map is zoomed in to. Below a zoom scale of 1:100,000 topographic layers are mainly from TRIM (Terrain Resource Information Management). These layers include Transport Structures, Rail, Roads, Rivers, Lakes, Land Cover and Contours.
Downloadable Datasets
A key objective of the Belt-Purcell project was to generate a series of GIS compatible data files that could be downloaded and incorporated into standard GIS software packages. Below is a list of the files currently available. The files are available as ESRI shape files because this format can be used in almost all commercially available GIS packages including ESRI’s free Arc Explorer. Two projections are currently available – UTM and Geographic. Also included for download is a Manifold GIS Map file that contains all of the layers used to build the Belt-Purcell metallogenic map. Manifold also supports the creation of Google Earth files for specific layers and a number of these have been generated for the project area.
References:
Höy, T., Price, R.A., Legun, A., Grant, B. and Brown, D. (1995): Purcell Supergroup, Southeastern British Columbia, Geological Compilation Map (82G, F, E; 82J/SW, 82K/SE); B.C. Ministry of Energy and Mines, Geoscience Map 1995-1, scale 1:250,000.
Höy, T. and Jackaman, W. (2004): Geology of the St. Mary map sheet (NTS 82F/09); Ministry of Energy and Mines, Geoscience Map 2004-1, scale 1:50,000.
Tectonostratigraphic Map Purcell Supergroup (841KB in PDF), after Trygve Hoy, Derek Brown and others, produced in MapInfo by Kennecott Canada Exploration Inc., April 19, 1999. From Purcell Anticlinorium partnership to scan mineral Assessment Reports.
Contacts and Notes:

View the Jennings River Geology map
This map, in Albers Equal Area projection, has all the datasets and Jennings River area detailed geology. It is part of the Jennings River/Wolf Lake component of the Ancient Pacific Margin NATMAP project, a cooperative effort with the Geological Survey of Canada. The present map area, 104O/14E and 15, is centrally located between other areas covered by the Jennings/Wolf project. Mapping by Nelson et al., 2001, is available at a 1:50,000 scale. The detailed map features Station Points, Features and Labels; Geology Lines, Polygons (stippled and solid) and Labels; Outcrops; and Eskers.
The map also includes the 2006 Jennings River Aeromagnetic Survey, which is also available in UTM Zone 9 projection.

View the Barkerville Geology map
The Barkerville area (NTS 093A, H and adjacent maps) map features geology layers of the Barkerville Cariboo and Kootenay terranes.

View the Lillooet LRMP Area map
This map, in Universal Transverse Mercator projection, has all the datasets in the Lillooet LRMP area. The area covers NTS maps 092IW, 092J and 092O(south). In addition to standard data sets, this map has a DEM image hillshade layer, a magnetics map layer, and a magnetics raster map with legend.
The Legend Window is organized into themes. Administrative layers are at the top, followed by mineral occurrence, ARIS, RGS and mineral title layers. Landuse planning and topographic layers, including TRIM, are in the middle of the legend window. Look for the detailed and provincial geology and raster layers near the bottom of the legend window. Two sets of Mineral Potential layers are available, a shaded version above the geology layers and a solid version below the geology layers.
To access the Geology Downloads and Crown Grant rasters, turn on the appropriate theme at the top of the legend and double click on the map area of interest. See FAQs for additional instructions.
The TRIM (Terrain Resource Information Management) layers, which are visible at a zoomed scale of 1:100,000, include Transport Structures, Rail, Roads, Rivers, Lakes, Land Cover and Contours in two layers. The Contours west 1:20K (<100K) layer covers this part of the province.

Mapping performed by W.J. McMillan, J.D. Blanch-Flower, P. McAndless, D. Coombes, P. Garvin; 1969-1974. Linework was digitally captured by Cominco Ltd. Downloads are available for the geology linework in shape format and a lithology table in Excel format.
Download ESRI Shape and MS Excel files Geographic Projection and lithology table (ZIP, 150 KB)

Displays Geology Unit, Lines, Structures, Mapping Stations, and Ages in the Vernon Area (NTS 082L03, 06, 11, 13, 14). Geology data is based on mapping by the Geological Survey of Canada.
References:
Acton, S.L.; Paradis, S.; Thompson, R.I.; Johnston, S.T. (2001): Geological setting of Paleozoic strata in the Mount Todd - Adams Lake region, south-central British Columbia; Geological Survey of Canada, Current Research, no. 2001-A7, 2001; 17 pages
Glombick, P.; Erdmer, P.; Thompson, R.I.; Daughtry, K.L. (2000): Geology of the Oyama map sheet, Vernon map area, British Columbia; Geological Survey of Canada, Current Research, no. 2000-A14, 2000; 10 pages
Breitsprecher, K.; Thorkelson, D.J.; Schwab, D.L.; Thompson, R.I. (2000): Volcanic stratigraphy and petrology of the eastern margin of the Kamloops Group near Enderby, British Columbia; Geological Survey of Canada, Current Research, no. 2000-A17, 2000; 7 pages
Glombick, P.; Erdmer, P.; Thompson, R.I.; Daughtry, K.L. (1999): Ductile shear zones and an Eocene unconformity between Kalamalka Lake and Oyama Lake, Vernon map area, British Columbia; in, Cordillera and Pacific margin / Interior Plains and Arctic Canada; Geological Survey of Canada, Current Research, no. 1999-A/B, 1999; pages 193-198
Unterschutz, J.; Erdmer, P.; Thompson, R.I.; Daughtry, K.L. (1999): Transition from Neoproterozoic to Triassic stratigraphy, Silver Star Mountain, Vernon map area, British Columbia; in, Cordillera and Pacific margin / Interior Plains and Arctic Canada; Geological Survey of Canada, Current Research, no. 1999-A/B, 1999; pages 199-204
Slemko, N.M.; Thompson, R.I. (1998): A re-evaluation of the geology adjacent to Shuswap Lake, Vernon map area, British Columbia; in, Cordillera and Pacific margin / Interior Plains and Arctic Canada; Geological Survey of Canada, Current Research, no. 1998-A/B, 1998; pages 175-179
Erdmer, P.; Thompson, R.I.; Daughtry, K.L. (1998): The Kalamalka Lake metamorphic assemblage, tectonic infrastructure in the Vernon map area, British Columbia; in, Cordillera and Pacific margin / Interior Plains and Arctic Canada; Geological Survey of Canada, Current Research, no. 1998-A/B, 1998; pages 189-194
Thompson, R.I.; Daughtry, K.L. (1997): Anatomy of the Neoproterozoic-Palaeozoic continental margin, Vernon map area, British Columbia; in, Cordillera and Pacific margin; Interior Plains and arctic Canada; Geological Survey of Canada, Current Research, no. 1997-A/B, 1997; pages 145-150
Thompson, R.I.; Daughtry, K.L. (1996): New stratigraphic and tectonic interpretations, north Okanagan Valley, British Columbia; in, Cordillera and Pacific margin; Geological Survey of Canada, Current Research, no. 1996-A, 1996; pages 135-141
Thompson, R.I.; Daughtry, K.L. (1994): A new regional mapping project in Vernon map area, British Columbia; in, Cordillera and Pacific Margin; Geological Survey of Canada, Current Research, no. 1994-A, 1994; pages 117-122
Johnson, B.J. (1990): Geology Adjacent To the Western Margin of the Shuswap Metamorphic Complex; BC Ministry of Energy, Mines and Petroleum Resources, Open File 1990-30, scale 1:100,000
Geophysics Maps
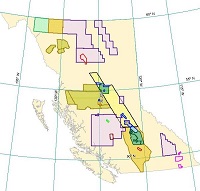
This map links to displays footprints for geophysics maps with links to Surveys. They include: the 2006 Bonaparte Lake and Jennings River surveys; 10 surveys in 2004-2005, which are shown on the 2005 Geophysical Surveys Map; 2002-2004 Mount Sylvester, Fran Property, Tisdall Lake, Horsefly, Quesnel, Toodoggone and Atlin surveys; and 11 archived surveys: Mount Milligan, Inzana-Salmon Lakes, Fish Lake, Endako, Clisbako River, Iron Mask, Interior Plateau (Williams Lake), East Kootenay (Southeast B.C.), Findlay River, Cassiar Mountains, Wolf-Capoose Lake, and Cranbrook Area. Surveys added May 25, 2007: 1999 Findlay River Aeromagnetic Survey, 1997 Cassiar Mountains Aeromagnetic Survey, 1997 Wolf-Capoose Lake Aeromagnetic and Multispectral Survey, and 1995 Cranbrook Area Aeromagnetic Survey. Provincial gravity data, including Bouguer, Free-air, and Isostatic Residual anomaly layers, are included on the maps. QUEST-Northwest Surveys added July 2, 2013: (GBC Report 2012-02 (Block 1 - between Dease Lake and Iskut), GBC Report 2012-03 (Block 2 - near Telegraph Creek) and GBC Report 2013-03 (Block 3 - near Iskut).
Geophysical data on this site is sourced from Natural Resources Canada. Geological Survey of Canada publication information and downloads can be located at GEOSCAN. Visit Geoscience Data Repository for Geophysical Data to download aeromagnetic, geochemical, gravity and radioactivity data.
General Terms and Conditions for Geophysical Data (PDF, 68 KB)

View Mount Milligan Geophysics map
Mount Milligan Geophysics covers four geophysical surveys: The 1991 Mount Milligan survey is represented in BCMEM Open File 2005-9 and GSC OF 2535 and the 1995 Inzana-Salmon Lake (Mount Milligan South) survey is represented in BCMEM Open File 2005-9 and GSC Open File 2801. The 2004 Mount Sylvester survey is represented in BCMEM Open File 2005-14 and the 2004 Fran Property survey is represented in BCMEM Open File 2005-15. The files are also available for download in georeferenced TIF and PNG formats and GeoSoft gridded data (.grd) format. The surveys were posted to MapPlace April 8, 2005.
General Terms and Conditions for Geophysical Data (PDF, 68 KB)
Survey Summaries:
Multiparameter (gamma-ray, magnetic) geophysical surveys are useful in mineral exploration and bedrock mapping studies. These surveys cover rocks of the Quesnel Terrane, a belt prospective for bulk tonnage copper-gold deposits similar to the well-known Mount Milligan deposit.
These surveys were published to MapPlace on April 8, 2005. The MapPlace data includes digital gridded images for 2 magnetic and 7 radiometric parameters for each survey area. The downloadable files from the British Columbia Ministry of Energy and Mines website will be in georeferenced TIF – tagged image and PNG formats (UTM NAD 83 and Albers projections) and GRD - Geosoft gridded data format (UTM Nad 83 only). PDF theme files area also available. A full product release (in late spring 2005) of the Mount Sylvester and Fran Property surveys will be made by the Geological Survey of Canada as a series of Open Files, including printed colour maps, images of the printed maps in PDF format, and digital line and grid data.
MOUNT MILLIGAN GEOPHYSICAL SURVEY
BCMEM Open File 2005-9 / GSC Open File 2535
Helicopter-borne gamma ray spectrometric and magnetic total field geophysical survey, Mount Milligan area, British Columbia
(Parts of NTS 93N/01; 93N/02SE; 93N/02NE; 93O/04SW; 93O/04NW)
Shives, R.B.K., Geological Survey of Canada
In 1991 the Geological Survey of Canada conducted a multisensor (gamma-ray spectrometric, magnetic total field) helicopter-borne geophysical survey in the Mount Milligan area, British Columbia, Canada. This data was published as GSC Open File 2535 in 1992 and to MapPlace as BCMEM Open File 2005-9 on April 8, 2005.
INZANA-SALMON LAKES GEOPHYSICAL SURVEY
BCMEM Open File 2005-9 / GSC Open File 2801
Helicopter-borne gamma ray spectrometric and magnetic total field geophysical survey, Inzana- Salmon Lakes area, British Columbia
(Parts of NTS 93J/13SW; 93J/13NW; 93K/15SW; 93K/15NW; 93K/16)
Shives, R.B.K, Holman, P.B. and Rebolledo, L., Geological Survey of Canada
In 1995 the Geological Survey of Canada conducted a multisensor (gamma-ray spectrometric, magnetic total field) helicopter-borne geophysical survey in the Inzana-Salmon Lakes (Mount Milligan South) area, British Columbia, Canada. This data was published as GSC Open File 2801 in 1995 and to MapPlace as BCMEM Open File 2005-9 on April 8, 2005.
MOUNT SYLVESTER GEOPHYSICAL SURVEY
BCMEM Open File 2005-14
Helicopter-borne gamma ray spectrometric and magnetic total field geophysical survey, Mount Sylvester area, British Columbia
(Parts of NTS 93N/8; 93O/5)
Shives, R.B.K., Carson, J.M., Dumont, R. and Holman, P.B., Geological Survey of Canada, and R. Lane, BC Ministry of Energy and Mines
In 2004 the Geological Survey of Canada conducted a multisensor (gamma-ray spectrometric, magnetic total field) helicopter-borne geophysical survey in the Mount Sylvester area, approximately due west of MacKenzie, British Columbia, Canada. Flight lines were oriented E-W, spaced at 500 m intervals. The survey was flown under contract by Fugro Airborne Surveys. Funding was provided by the British Columbia and Yukon Chamber of Mines Rocks to Riches Program, under a project submitted by the District of MacKenzie. Support for the Geological Survey of Canada’s Radiation Geophysics Section, acting as the Scientific Authority for the survey, was provided under Natural Resources Canada – Earth Sciences Sector’s Northern Resources Development Program. This survey covers rocks of the Quesnel Terrane, a belt prospective for bulk tonnage copper-gold deposits similar to the well-known Mount Milligan deposit.
This data was published to MapPlace as BCMEM Open File 2005-14 on April 8, 2005. A full product release (in late spring 2005) was made by the Geological Survey of Canada as a series of Open Files, including printed colour maps, images of the printed maps in PDF format, and digital line and grid data.
FRAN PROPERTY GEOPHYSICAL SURVEY
BCMEM Open File 2005-15
Helicopter-borne gamma ray spectrometric and magnetic total field geophysical survey, Fran Property Area, British Columbia
(Parts of NTS 93K/16; 93N/1)
Shives, R.B.K., Carson, J.M., Dumont, R., Holman, P.B. and Wells R., Geological Survey of Canada
In 2004 the Geological Survey of Canada conducted a multisensor (gamma-ray spectrometric, magnetic total field) helicopter-borne geophysical survey in the Fran Property Area, southwest of Mount Milligan, British Columbia, Canada. Flight lines were oriented N-S, spaced at 150 m intervals. The survey was flown under contract by Fugro Airborne Surveys. Funding was provided by Yankee Hat Industries Corp. Support for the Geological Survey of Canada’s Radiation Geophysics Section, acting as the Scientific Authority for the survey, was provided under Natural Resources Canada – Earth Sciences Sector’s Northern Resources Development Program.
This data was published to MapPlace as BCMEM Open File 2005-15 on April 8, 2005. A full product release (in late spring 2005) was made by the Geological Survey of Canada as a series of Open Files, including printed colour maps, images of the printed maps in PDF format, and digital line and grid data.
Download files:

Quesnel Trough Geophysics covers four geophysical surveys: 1993 Quesnel and 2003 Horsefly surveys are represented in BCMEM Open File 2004-9, GSC OF 4615 and GSC OF 4616; 2003 Imperial Metals Corp. Mount Polley survey is represented in BCMEM Open File 2004-10 and GSC OF 4619; 2004 Tisdall Lake survey is represented in BCMEM Open File 2005-16. The files are also available for download in georeferenced TIF and PNG formats and GeoSoft gridded data (.grd) format. The 2003 surveys, including the Toodoggone Geophysics, were posted to MapPlace March 26, 2004. Bulletin 97 (PDF) describes the geology and mineral deposits of the Quesnel River - Horsefly Map Area, Central Quesnel Trough, British Columbia. The 2004 survey was posted to MapPlace April 8, 2005.
July 31, 2006: Additional surveys conducted in 2004-2005 resulted in new compilations shown on the 2005 Geophysical Surveys Map.
A 1:250 000 scale geophysical map of Quesnel Lake, compiled using survey data acquired between 1991 and 2005, is available as Geological Survey of Canada, Open File 5295; free Download from GEOSCAN.
General Terms and Conditions for Geophysical Data (PDF, 68 KB)
How the Magnetic and Radiometric Maps Can be Used:
Multiparameter (gamma-ray, magnetic) geophysical surveys are useful in mineral exploration and bedrock mapping studies. In the Quesnel Trough, these surveys are particularly useful in exploring for alkalic porphyry Cu-Au porphyry deposits like Mt. Polley, or related deposits like QR. The potassium, potassium/thorium, magnetic total field and magnetic vertical gradient maps can be used to help identify potassic alteration and magnetite enrichment/depletion zones associated with copper-gold mineralization, and also help in mapping lithologies and structures.
Survey Summary:
The 1993 Mount Polley survey was flown with the GSC Sky-van fixed wing aircraft. Flight lines were flown in an east-west direction with a line-spacing averaging 500 m. The data was released in 1995 as GSC Open File 2802 by R.B.K. Shives et al.
HORSEFLY MULTISENSOR GEOPHYSICAL SURVEY
Open File 2004-9 / GSC OF 4615 & GSC OF4616
Helicopter-borne gamma ray spectrometric and magnetic total field geophysical survey, Horsefly Area, British Columbia
(Parts of NTS 93A/3,5,6,11)
Shives, R.B.K., Carson, J.M., Ford, K.L., Holman, P.B., Cathro, M.
In 2003 the Geological Survey of Canada conducted a multisensor (gamma-ray spectrometric, magnetic total field) helicopter-borne geophysical survey in the Horsefly area, British Columbia, Canada. Flight lines were oriented NE-SW, spaced at 500 m intervals. The survey was flown under contract, by Fugro Airborne Surveys. Results are combined with the previously flown 1993 Mount Polley Survey (93A/12). The survey was funded by the British Columbia and Yukon Chamber of Mines’ “Rocks to Riches” Program. This data was published as GSC OF 4615 & GSC OF 4616 in 2004 and to MapPlace as BCMEM Open File 2005-9 on March 26, 2004.
IMPERIAL METALS CORP. MOUNT POLLEY 2003 MULTISENSOR GEOPHYSICAL SURVEY
Open File 2004-10 / GSC OF 4619
Helicopter-borne gamma ray spectrometric and magnetic total field geophysical survey,
Imperial Metals Corporation’s Mount Polley Mine area, British Columbia
(Part of NTS 93A/12)
Shives, R.B.K., Carson, J.M., Ford, K.L., Holman, P.B., Cathro, M.
In 2003 Imperial Metals Corporation conducted a multisensor (gamma-ray spectrometric, magnetic total field) helicopter-borne geophysical survey over the Mount Polley Mine area, British Columbia, Canada. Flight lines were oriented east-west, spaced at 100 m intervals. The survey was flown under contract, by Fugro Airborne Surveys. The survey was funded by Imperial Metals Corporation and the British Columbia & Yukon Chamber of Mines "Rocks to Riches" Program. This data was published as GSC OF 4619 in 2004 and to MapPlace as BCMEM Open File 2005-10 on March 26, 2004.
TISDALL LAKE 2004 MULTISENSOR GEOPHYSICAL SURVEY
Open File 2005-16
Helicopter-borne gamma ray spectrometric and magnetic total field geophysical survey, Tisdall Lake area, British Columbia
(Parts of NTS 92P/15; 93A/2, 3,6,7)
Shives, R.B.K., Carson, J.M., Dumont, R., Holman, P.B., Yeager, D., Geological Survey of Canada
In 2004 the Geological Survey of Canada conducted a multisensor (gamma-ray spectrometric, magnetic total field) helicopter-borne geophysical survey in the Tisdall Lake Area, southeast of Mount Polley, British Columbia, Canada. Flight lines were oriented NE-SW, spaced at 250 m intervals. The survey was flown under contract by Fugro Airborne Surveys. Funding was provided by Amarc Resources Ltd. Support for the Geological Survey of Canada’s Radiation Geophysics Section, acting as the Scientific Authority for the survey, was provided under Natural Resources Canada – Earth Sciences Sector’s Northern Resources Development Program.
This data was published to MapPlace as BCMEM Open File 2005-16 on April 8, 2005. A full product release (in late spring 2005) will be made by the Geological Survey of Canada as a series of Open Files, including printed colour maps, images of the printed maps in PDF format, and digital line and grid data.

View Toodoggone Geophysics map
The Toodoggone map features new multisensor, airborne geophysical surveys, which includes 2 magnetic and 8 radiometric parameters. The files are also available for download in georeferenced TIF and PNG formats and GeoSoft gridded data (.grd) format. The 2003 surveys, including the Horsefly/Mount Polley Geophysics, were posted to MapPlace March 26, 2004.
General Terms and Conditions for Geophysical Data (PDF, 68 KB)
Survey Background
TOODOGGONE MULTISENSOR GEOPHYSICAL SURVEY
Open File 2004-8
Helicopter-borne gamma ray spectrometric and magnetic total field geophysical survey, Toodoggone Area, British Columbia
(Parts of NTS 94D/15, E/2,3,6,7,10,11)
R.B.K. Shives, J.M. Carson, K.L. Ford, P.B. Holman, L. Diakow
In 2003 the BC Ministry of Energy, Mines and Petroleum Resources and the Geological Survey of Canada conducted a multisensor (gamma-ray spectrometric, magnetic total field) helicopter-borne geophysical survey in the Toodoggone area, British Columbia, Canada. Flight lines were oriented NE-SW, spaced at 400 m intervals. The survey was flown under contract, by Fugro Airborne Surveys. The survey was funded by the British Columbia Ministry of Energy, Mines and Petroleum Resources and Natural Resources Canada through the Targeted Geoscience Initiative, and by a consortium of companies including Bishop Resources Inc., Finlay Minerals Ltd., Northgate Exploration Ltd., Sable Resources Ltd.,and Stealth Minerals Ltd.
Purpose and Methodology
The overall purpose of the surveys is to provide modern high-definition radiometric and magnetic data that can be used in the assessment and development of targets for mineral exploration, and to assist in future bedrock and surficial mapping studies. The Geological Survey of Canada has had good results in previous multisensor surveys over similar BC porphyry deposits (e.g. Afton and Mt. Milligan). The radiometric (K and eTh/K ratio) and magnetic (total field and calculated vertical gradient) maps are particularly useful in identifying potassic alteration and magnetite enrichment/depletion zones associated with these copper-gold deposits, and in mapping bedrock lithologies and structures.
The surveys were completed during August and September 2003 using an Aerospatiale AS350 helicopter. The flight path was recovered using a post-flight differential Global Positioning System. A vertically mounted video camera was used for verification of the flight path. The traverse lines were flown at an average spacing of 400 m for Toodoggone, (500 m for Horsefly and 100 m for Imperial Mt. Polley) with control lines flown at 4000 m intervals (2000 m for Imperial Mt. Polley). Helicopter flight height was maintained at an average ground clearance of 135 m (60 m).
The gamma ray spectrometry data were recorded at a 1.0 second sample rate using a 256-channel Exploranium GR820 spectrometry system with 33.6 liters of downward-looking and 4.2 liters of upward-looking sodium iodide detectors. The aeromagnetic data were recorded at a 0.1 second sample rate using a 0.01 nT split-beam line cesium vapour magnetometer suspended below the helicopter.
Final results will be presented in GSC and BCGS Open File formats in May 2004. The Open Files will consist of digital data (Geosoft compatible line and gridded formats) and colour interval maps at 1:20,000 and 1:50,000 scales, for 10 layers (listed below). Map images will be presented as georeferenced .tif files for easy import into GIS programs and as .pdf files with marginal notes, legend and topographic base information. Data will be made available for purchase as digital line or grid data on CD-ROM (from GSC only), in paper format as print-on-demand colour maps from GSC (only) and as web-viewable, downloadable images in PDF format, at no cost, from BCGS and GSC websites.
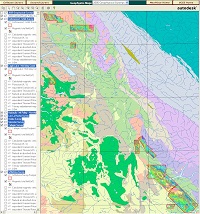
View 2005 Geophysical Surveys map
GSC Open Files: 5284 to 5293 by J.M. Carson, R. Dumont, J. Potvin, R.B.K. Shives, B.J.A. Harvey, J. Buckle, B. Lane, M. Cathro (10 open files, 10 sheets each)
The Geological Survey of Canada released multisensor (gamma ray spectrometric and magnetic) airborne geophysical information for 10 areas of central British Columbia. These surveys were conducted by Fugro Airborne Surveys under contract to the Geological Survey of Canada (GSC). They were funded by a number of provincial, industry and First Nation partners, including the British Columbia and Yukon Chamber of Mines' "Rocks to Riches" program, Richfield Ventures Corp., Amarc Resources Ltd., Yekooche First Nation, Yankee Hat Minerals Ltd., Serengeti Resources Inc., and GWR Resources Inc., and supported by Natural Resources Canada as part of the Earth Sciences Sector's Northern Resources Development Program.
We would like to acknowledge Cal Data Inc. for the image processing into georeferenced TIFF and PNG images.
General Terms and Conditions for Geophysical Data (PDF, 68 KB)

View Quest Airborne Gravity map
Sander Geophysics Limited (SGL) conducted a high-definition airborne gravity survey for Geoscience BC (GBC) from December 2007 to March 28, 2008.The survey was flown using SGL’s airborne gravity system designated AIRGrav (Airborne Inertially Referenced Gravimeter). The block covered much of the Quesnellia Area of British Columbia and is part of Geoscience BC’s QUEST (QUesnellia Exploration STrategy Project).
General Terms and Conditions for Geophysical Data (PDF, 68 KB)

View Quest-West Airborne Gravity map
Sander Geophysics Limited (SGL) conducted a high-definition airborne gravity survey for Geoscience BC (GBC) from May to July, 2008.The survey was flown using SGL’s airborne gravity system designated AIRGrav (Airborne Inertially Referenced Gravimeter). The survey covered an area of over 40,000 square kilometres, and includes the communities of Vanderhoof, Fraser Lake, Burns Lake, Topley, Granisle, Houston, Telkwa, Smithers and Kitimat.
General Terms and Conditions for Geophysical Data (PDF, 68 KB)

View Quest-South Airborne Gravity map
Sander Geophysics Limited (SGL) conducted a high-definition airborne gravity survey for Geoscience BC (GBC) in the QUEST South area of British Columbia. The survey was flown from September 1 to November 1, 2009. The survey block is situated in the southwestern part of British Columbia and consists of an irregular polygon, with a maximum length of 352 km and a maximum width of 171 km. The survey was flown using SGL's airborne gravity system designated AIRGrav (Airborne Inertially Referenced Gravimeter).
See Geoscience BC QUEST-South Project for a summary and downloads
General Terms and Conditions for Geophysical Data (PDF, 68 KB)

View QUEST Northwest Block 1-3 Project Area Map
Aeroquest Airborne conducted a helicopter-borne magnetic survey on Block 1; and Geo Data Solutions GDS Inc. conducted helicopter-borne magnetic surveys on Blocks 2 and 3 of the QUEST-Northwest project area for Geoscience BC (GBC).
Block 1: between the communities of Dease Lake and Iskut, BC in the summer and fall of 2011. This airborne magnetic survey was flown by Aeroquest Airborne with a line spacing of 250 m, and the total survey coverage is 27,012 line-km.
Block 2: near the community of Telegraph Creek, BC in the summer and fall of 2011. This airborne magnetic survey was flown by Geo Data Solutions with a line spacing of 250 m, and the total survey coverage is 11,345 line-km.
Block 3: located near the community of Iskut, BC in July and August of 2012. This high-definition heliborne survey was flown by Geo Data Solutions with a line spacing of 250 m, and the total survey coverage is 5746 line-km. The report also includes 200 line-km of airborne magnetic data purchased from New Chris Minerals Ltd. This dataset was collected in late 2011 and early 2012 at a 100 m line-spacing, and lies in the centre of the Block 3 area.
These surveys are all part of Geoscience BC’s QUEST (QUesnellia Exploration STrategy Project).
General Terms and Conditions for Geophysical Data (PDF, 68 KB)

A high-resolution aeromagnetic and airborne gamma-ray spectrometric geophysical survey in the Bonaparte Lake area (parts of NTS 92P and 093A) was completed in 2006. Funding for the survey was provided by Geoscience BC, Natural Resources Canada’s Targeted Geoscience Initiative (TGI3), Candorado Operating Company Ltd., GWR Resources Inc. and Amarc Resources Ltd. Project management was undertaken by the Geological Survey of Canada. The western portion of the survey area was surveyed with a fixed-wing by Sander Geophysics Ltd., while the eastern portion was surveyed with a helicopter by Fugro Airborne Surveys. This map, in UTM Zone 10 projection, features 2 magnetic parameters, residual total magnetic field and first vertical derivative of the magnetic field, and multisensor gamma ray spectrometric geophysical data.
The files are available for download in various formats. Details of the aeromagnetic survey can be found in the Fieldwork 2006 article by Miles, W.F., Shives, R.B.K., Carson, J., Buckle, J., Dumont, R. and Coyle, M: Airborne Gamma-Ray Spectrometric and Magnetic Surveys over the Bonaparte Lake Area (NTS 092P), South-Central British Columbia.
GBC Maps 2007-3-1 to 9 and 2007-4-1 to 8 / GSC OF 5488 - 5504
General Terms and Conditions for Geophysical Data (PDF, 68 KB)

View Jennings River Geophysics map
(GBC Maps 2007-1-01 to 2007-1-16 and 2007-2-01 to 2007-2-16 / GSC OF 5351 - 5382)
A Jennings River high-resolution aeromagnetic survey (NTS 104O) was completed in 2006. Funding for the survey was provided by Geoscience BC (Project 2005-059) and project management was undertaken by the Geological Survey of Canada. The survey was flown under contract by Goldak Airborne Surveys, Saskatoon. This map, in UTM Zone 9 projection, features 2 magnetic parameters, residual total magnetic field and first vertical derivative of the magnetic field.
The map also displays geological mapping by Nelson et al., 2001 in the 104O/14E and 15 maps areas (see also Jennings River map in Albers projection). The files are available for download in various formats. Details of the aeromagnetic survey can be found in the Fieldwork 2006 article by Miles, W.F., Dumont, R. and Lowe, C.: Aeromagnetic Survey over the Jennings River Map Area, Northern BC.
General Terms and Conditions for Geophysical Data (PDF, 68 KB)
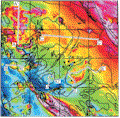
GSC Open Files 4091 to 4106
Approximately 30 375 line kilometres of high-resolution aeromagnetic data were acquired in the Atlin map area (NTS 104N), northwestern British Columbia, between September 2000 and March 2001. The survey, flown by SIAL Geosciences Inc. under contract to the Geological Survey of Canada, was funded by the federal government's Targeted Geoscience Initiative. Much of the surveyed area is underlain by oceanic sedimentary, volcanic, and volcaniclastic rocks interleaved with structural panels of ultramafic and other ophiolitic rocks that make up the Cache Creek Terrane. Significant contrasts in magnetic properties among many of these rock types result in a data set that is rich in magnetic anomalies and trends and, as such, a valuable aid to bedrock mapping and mineral exploration currently underway in the region.
General Terms and Conditions for Geophysical Data (PDF, 68 KB)

BCGS OF 2005-11 /GSC OF 3534
Endako Geophysics covers the 1997 Endako area survey and is available as Geological Survey of Canada Open File 3534 for downloads. This survey was published to MapPlace on April 8, 2005. The MapPlace data includes digital gridded images for 2 magnetic and 7 radiometric parameters for each survey area. The downloadable files from this website are in georeferenced TIF – tagged image and PNG formats (UTM NAD 83 and Albers projections) and GRD - Geosoft gridded data format (UTM NAD 83 only). PDF theme files are also available.
General Terms and Conditions for Geophysical Data (PDF, 68 KB)

View Findlay River Geophysics map
The Findlay River map features an airborne aeromagnetic survey conducted in 1997. The map shows residual magnetic intensity.
General Terms and Conditions for Geophysical Data (PDF, 68 KB)
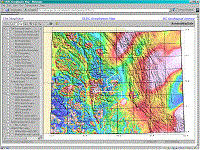
Displays three geophysical layers, Kootmag, Magnetics and Thorium ratios, from the GSC Pacific Geoscience Centre. A sample detailed orthophoto (1 metre pixels) is available for area 082F.099 at 1:35,000 scale.
General Terms and Conditions for Geophysical Data (PDF, 68 KB)

View Interior Plateau Aeromagnetics map
Summary of Geological, Geochemical and Geophysical Studies (94N; 92O; 93B; 93C; 93F; 93G; 93K)
BCGS Paper 1997-02
Interior Geoscience Project: Summary of geological, geochemical and geophysical studies, Diakow, L J; Newell, J M; Geological Survey of Canada, Open File 3448; 1997; 256 pages.
High Resolution regional aeromagnetic survey - Interior Plateau, British Columbia, Teskey, D; Stone, P; Mustard, P S; Metcalfe, P; Geological Survey of Canada, Open File 3448; 1997; pages 221-224.
Magnetic residual total field, Interior Plateau of British Columbia, Geological Survey of Canada, Open File 2785, 1994, revised 1995; 19 maps, 1:100,000 and 1:250,000 scales.
General Terms and Conditions for Geophysical Data (PDF, 68 KB)

View Cranbrook Geophysics and Geology map
The Cranbrook map features an airborne aeromagnetic survey, conducted in 1993 and 1994.
General Terms and Conditions for Geophysical Data (PDF, 68 KB)
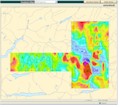
View Wolf-Capoose Lake Geophysics map
The Wolf-Capoose Lake map features multisensor, airborne geophysical surveys, which includes one magnetic and eight radiometric parameters. This 1997 survey is included with the Interior Plateau geophysics map.
General Terms and Conditions for Geophysical Data (PDF, 68 KB)

The Cassiar map features an airborne aeromagnetic survey, conducted in 1995 and 1996.
General Terms and Conditions for Geophysical Data (PDF, 68 KB)

General Terms and Conditions for Geophysical Data (PDF, 68 KB)

Iron Mask Geophysics covers the 1995 Iron Mask survey represented in Geological Survey of Canada Open File 2817. This survey was published to MapPlace on April 8, 2005. The MapPlace data includes digital gridded images for 2 magnetic and 7 radiometric parameters for each survey area. The downloadable files from this website are in georeferenced TIF – tagged image and PNG formats (UTM NAD 83 and Albers projections) and GRD - Geosoft gridded data format (UTM NAD 83 only). PDF theme files, which represents a subset of the geophysical data, available in Open File 2006-12: Integrated Airborne Geophysical, Geology and Mineral Occurrence Data, Iron Mask Batholith. Geology of the Iron Mask Batholith is available as Open File Map 2006-11.
See GeoFile 2006-5 for a review of the regional geological setting, tectonics, geochronology, geophysics, mineralization and alteration characteristics of the Iron Mask Batholith.
General Terms and Conditions for Geophysical Data (PDF, 68 KB)

View Clisbako River Geophysics map
Clisbako River Geophysics covers the 1994 Clisbako survey represented in Geological Survey of Canada Open File 2815. This survey was published to MapPlace on April 8, 2005. The MapPlace data includes digital gridded images for 2 magnetic and 7 radiometric parameters for each survey area. The downloadable files from this website are in georeferenced TIF – tagged image and PNG formats (UTM NAD 83 and Albers projections) and GRD - Geosoft gridded data format (UTM NAD 83 only).
General Terms and Conditions for Geophysical Data (PDF, 68 KB)
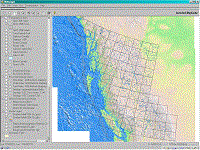
This map is projected in Lambert Conformal Conic, NAD 27. This map contains most of the layers in the BCGS Geology map, plus some provincial scale images showing Gravity, Aeromagnetics, Landsat and DEM Shaded Relief. These images come directly from the CORDLINK server in Vancouver.
General Terms and Conditions for Geophysical Data (PDF, 68 KB)
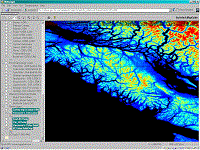
This map, in Geographic projection, contains most of the layers in the BCGS Geology map, plus a colour shaded relief map based on the GTOPO30 data set and a radar mosaic for the southern portion of the province. More detailed colour relief, radar mosaic and DEM are available for Vancouver Island. These raster layers, which are located at the bottom of the map legend, are from GeoGratis (NRCan), a website and FTP site that distributes geospatial data of Canada free of charge.
General Terms and Conditions for Geophysical Data (PDF, 68 KB)
Mineral Activity and Potential Maps

This map features Major Exploration, Development, Mines and Reclamation Projects; Electoral Boundaries; and updated Land Use Plan layers with details and links to Regional Land Use Plan web pages. Historic Mines (2959 sites), with links to 67 site visit reports, are also displayed in the Mineral Inventory group. Use the POPUP MENU to link to the following websites: Mines Directories by Year, Mineral Statistics and Coal in BC.
Note: This map is no longer updated.

View Atlin-Taku Mineral Potential map
The BC Geological Survey conducted a Level 2 Mineral Resource Assessment of the Atlin-Taku Land Planning area which encompasses approximately 4 million hectares in northwest B.C. The primary purpose of this assessment was to provide more detailed and up-to-date information on metallic and industrial mineral resource potential in the Atlin-Taku landuse planning area.
The new Atlin-Taku mineral resource assessment reflects the knowledge and understanding of a panel of experts who know the geology and mineral resources of the area through many years of on-the-ground exploration and mapping expertise. However, as more exploration and geologic mapping is done in this relatively remote part of British Columbia, the perceived potential of the different geologic tracts might also be expected to change. Therefore, users are cautioned to consider the current mineral potential map of the Atlin-Taku area to be a snapshot in time only.
This interactive map displays metallic and industrial mineral potential, inventory values, and geology of the Atlin-Taku land-use area. It is one component of BCGS GeoFile 2009-05, Atlin-Taku Mineral Resource Assessment by D.G. MacIntyre and W.E. Kilby.

For the past 150 years, mining has been an important industry in British Columbia. During that time, the regulations and practices surrounding this industry have evolved and improved immensely. In May 2000 the Historic Sites Project was initiated by the Reclamation Section of the Mining Division to begin building an inventory of Historic mine sites around the province. The purpose of this program was to identify high priority sites where environmental and health concerns exist. The Historic Mines Atlas is an interactive map that presents this information through a variety of data layers and displays over 1100 past producing mines. The Atlas is based on a 125-page report on a scoping study of the 1887 historic mines in BC (Open File 2003-03). The Historic Mines Atlas is a joint publication of Environment Canada, Pacific and Yukon Region, Environmental Protection Branch and former BC Ministry of Energy, Mines and Petroleum Resources.
Quick Start-Up to the BC Historic Mines Atlas:
- To view the Historic Mines Atlas, you must download the Autodesk MapGuide Viewer (Version 6.5), ZIP, 3 MB.
- Open the map (link above).
- The screen, ’Welcome to the British Columbia Historic Mines Atlas’ has two buttons. The Atlas Description button provides a link to the mines atlas 37-page manual, in .PDF form. The Launch Atlas button is to enter the atlas
- Enter the atlas. Any user may do so by entering VIEW as a UserName, and VIEW as the Password. Only Environment Canada and BC Ministry of Energy, Mines and Petroleum Resources staff are able to post data onto the atlas (or edit or delete data) in the ‘environmental data’ layer, denoted by the green flags.
- If you have successfully downloaded the software, you will see the atlas home page with ‘layers’ on the left, and a small-scale map of BC on the right. The map has small green flags. The large brown buttons on the toolbar on the upper right include ‘Options’ which opens another toolbar. One of these will expand all map layer group, which is necessary to see contours, roads and other features. Note that some features will not appear until the scale is very large, e.g. larger than 1:100,000, or as large as 1:20,000.
- For a quick view of the atlas’s potential, find the ‘zoom go to’ button (upper left, a magnifying glass with an arrow). Under Category, 1. Mine -> Mine Name, enter Hidden Creek (aka Anyox) and for map width, enter 10 (10 km), which will show the mine site at a scale of between 1:50,000 and 1:75,000. The features imbedded in the map of this site include water quality and shellfish tissue sampling results, photographs and written reports. Here, as for anywhere within BC, map layers for contours, roads, towns, streams and other geographic and cultural features can be turned on or off using the menu on the left. See the Users Manual Section 2.11, page 29 on Viewing Reports. Printing the maps in colour is possible at any scale.
Downloadable Datasets:
Excel Table of Historic Mines – Open File 2003-03
References:
Barazzuol, Lisa N. and Stewart, Gregg G. (2003): Historic Mines of British Columbia, Ministry of Energy, Mines and Petroleum Resources, Open File 2003-03, 142 pp.
British Columbia Historic and Operating Mines (Version 2.01) Virtual Atlas, March 2004, revised May 2007; prepared for: Environment Canada Pacific and Yukon Region Environmental Protection Branch and former BC Ministry of Energy, Mines and Petroleum Resources; prepared by Suzanne Richer, Community Mapping Network.
For further information contact:
Oil, Gas and Coal Maps

View Petroleum Tenure & Wells map
This map displays northeastern BC Petroleum and Natural Gas well locations, tenure, PNG grid, oil & gas fields and major pipelines. Tools allow searches for tenure owner, tenure number, range of tenure numbers, well site name, and BC Gazetteer locations. Coal deposits, coal fields and coal tenure (visible < 1M scale) are also included on this map.
View Integrated Petroleum System (IPS) or IPSWeb
Available Petroleum Layers:
| Petroleum Layers |
Visible Scale |
MapPlace Report |
Queries |
|
Well Surface Hole LRDW |
<15M |
Yes (<1.5M) |
Well Site by Well Number/ZoomGoto |
|
Well Bottom Hole LRDW |
<15M |
Yes (<1.5M) |
ZoomGoto |
|
Well Directional Survey LRDW |
<15M |
Yes (<1.5M) |
ZoomGoto |
|
Oil & Gas Pipelines |
<16M |
- |
- |
|
PNG Wells NE (2002) |
<15M |
Yes |
- |
|
PNG Wells SE |
<15M |
- |
- |
|
PNG Wells SW (2002) |
<50M |
Yes |
ZoomGoto |
|
Petroleum Tenure |
<3M |
Yes |
Tenure Number/Tenure Number Range/Tenure Owner/ZoomGoto |
|
Petroleum Tenure Labels |
<300K |
Yes |
- |
|
PNG Grid Groups, Blocks, Units with Labels |
<100K for Units |
- |
- |
|
PNG Grid Labels (NE only) |
<100K |
- |
- |
|
PNG Peace River Grid |
<100K |
- |
- |
|
Offshore Wells |
All Scales |
- |
- |
|
PNG Reports Locations |
<25M |
Yes |
- |
|
NE Oil & Gas Fields |
<5M |
- |
ZoomGoto |
|
NE Oil & Gas Field Labels |
<1M |
- |
- |

The Ministry of Energy and Mines maintains a library of over 990 Coal Assessment Reports submitted by exploration companies and mines dating from 1900. Reports off-confidential are available for viewing and downloading from the Web. Some exploration data from the reports, such as trench, borehole and bulk sample information, have been summarized into a set to digital tables called COALFILE.
The Coal Map features Coal Geology layers, data tables from COALFILE and links to Coal Assessment Reports and Coalfield Maps in PDF format. The Coal Geology layers consist of main Coalfields in BC and details of the Hat Creek coal area. An interactive map of the Hat Creek area is also available.
COALFILE database layers on the Coal Map include an index of the Coal Assessment Reports, Bulk samples, Trench data and Borehole data. All the COALFILE layers have links to reports and table downloads. PDF versions of the Coal Assessment Reports are available through a linked report. To access the tables and reports turn on the appropriate layer, use the select tool to select the objects on the map and the view report tool to create a report or download.
Coal Assessment Reports: All Coal Assessment Reports are scanned into PDF format and can be viewed or downloaded from through the Coal Map. Reports are also available through the Online COALFILE Search application.
Coalfield maps in PDF format are linked to the Coal PDF Maps layer. To view the maps, turn on the Coal PDF Maps layer in the File Download Layers group and double click each area. This creates a report including a summary of the Coalfield, links to coal deposit descriptions in MINFILE, links to Coal Assessment Reports, and the Coalfield maps in PDF format.

A major resource of lignite to subbituminous B coal exists in a graben, 26 kilometres long and 4 kilometres wide, that occupies the Hat Creek Valley. The Tertiary rocks in the graben contain a coal member that is about 1200 metres thick, of which up to 550 metres is coal. This is one of the thickest accumulations of coal in the world. Two potential mining areas have been outlined and designated as deposits 1 in the north and 2 in the south. Deposit 1 contains two coal seams. The upper is 120 to 250 metres thick and the lower, which is 450 to 550 metres thick, is divided into 3 parts. The deposit is faulted and seams are folded and moderately to steeply dipping. The area contains a resource of about 10 billion tonnes, of which approximately 500 million tones of proven reserve are within the Number 1 deposit. The area was considered for development in conjunction with the construction of a thermal power plant, but at the moment plans are shelved.
This interactive map displays detailed geology of the Hat Creek area and includes exploration wells, photo locations (double click to view photos), geological cross sections (double click to view sections), outcrop locations and gravity data. The Coal Assessment Reports layer displays the location of 31 reports, including some exploration data from the reports, such as trench, borehole and bulk sample information. This data is from the COALFILE which is available for download. The Hat Creek Coalfield Page tabulates the available reports on Hat Creek, including PDF maps.
The following links are from the Oil and Gas Division:
Petroleum Open File 2003-2:
Geology of the Hat Creek Coalfield
Sheet 1 of 3
Projection: Universal Transerse Mercator, Zone 10 (NAD83)
Geology Interpretation: B. Neil Church, Ph.D., P.Eng.
Cartography/GIS: Mike Fournier
Map Size: 36” wide x 50” high
PDF (4.16MB)
Air Photo Mosaic of the Hat Creek Coalfield
Sheet 2 of 3
Projection: Universal Transverse Mercator, Zone 10 (NAD 83)
Air Photo Compilation: Geoff Tomlins, Pacific Geomatics Ltd.
Geology Interpretation: B. Neil Church, Ph.D., P.Eng.
Cartography/GIS: Mike Fournier
Map Size: 36” wide x 50” high
PDF (61MB) RAR 1 2 3 4 5 6 7
Note: RAR files are 10MB each. After successful download of all the components, click on part1.rar to unzip.
Hat Creek Coalfield – Geological Cross Sections
Sheet 3 of 3
Software: CorelDRAW version 10
Geology Interpretation: B. Neil Church, Ph.D., P.Eng.
Computer Graphics: John Armitage, Armitage CAD – Computer Drafting
Compiled by: Mike Fournier
Figure Size: 42” wide x 44” high
PDF (150KB)
Some Extra Downloads:
Hat Creek
Scale: 1: 100,000
Projection: Albers Equal Area Conic (NAD 83)
PDF (1.6MB)
Hat Creek Landsat
Scale: 1: 100,000
Projection: Albers Equal Area Conic (NAD 83)
PDF (6.4MB)
Miscellaneous Maps

This map displays the results of seven (7) aggregate potential studies, including: Prince George, Okanagan, Nanaimo, Sea-to-Sky, Sunshine Coast, North Coast and northeast British Columbia. Digital Data Downloads are available for these studies. Each study represents areas of aggregate resource potential as polygons on the map and qualitatively ranks the relative potential of the areas. The studies include landforms and pit locations. The NEBC Aggregate area displays and reports on roads, showings, prospects and deposits. Other Aggregate Pit data displayed on the map include: 724 Private Pits (637 permitted and 87 reclaimed) based on an 1996 compilation of Notices of Work (Open File 1996-05); 1551 Construction Aggregate Operations compiled in April 2004; and 1699 Public and Private Pits compiled in March 2004.
The Legend Window is organized into themes. Look for the geology, mineral occurrence, ARIS and mineral title layers at the bottom of the legend window. Administrative layers are at the top. Topographic layers, including TRIM, are in the middle of the legend window. Two sets of Mineral Potential layers are available, a shaded version above the geology layers and a solid version below the geology layers. The aggregate potential layers are located above the geology layers in the legend.
Aggregate pit layers for the Okanagan, Nanaimo, Sea-to-Sky, Sunshine Coast and North coast areas are located below the mineral inventory layers in the legend. Photos of Sea-to-Sky aggregate pits are available, mainly in the north part of the study area. Reports and photos of Sunshine Coast aggregate pits are available for most of the pits. To view the reports or photos, use the select tool and double click if a hand shows while on the pit symbol.
Northeast BC Aggregate Mapping Program
Overview Aggregate and the Environment Publication (PDF): http://www.agiweb.org/environment/publications/aggregate.pdf
References:
Bichler, A.J., Brooks, E.D., and Bobrowsky, P.T. (2002); Sunshine Coast Aggregate Potential Mapping Project (parts of NTS 092F08,09,10,15,16, 092F15,16; 092G05,06,11,12,13, 092J04, 092K01,02,03,06,07,08,09), B.C. Ministry of Energy and Mines, Fieldwork 2001, Paper 2002-1, pp 403-408. (PDF document, 2.6 Mb)
Bobrowsky, P.T., Massey, N.W.D., and Matheson, A. (1996); Aggregate Resource Potential of the Prince George Area (NTS 093G10,14,15,16, 093H02), B.C. Ministry of Employment and Investment, Open File 1996-24.
Bobrowsky, P.T., Massey, N.W.D., and Matheson, A. (1998); Aggregate Resource Potential of the Okanagan Area (NTS 0 82E(west) and 0 82L(west)), B.C. Ministry of Energy and Mines, Open File 1998-5.
Massey, N.W.D., Matheson, A., and Bobrowsky, P.T. (1998); Aggregate Resource Potential of the Nanaimo Area (parts of NTS 0 92B12,13, 0 92C09, 0 92F01,02,07,08, 0 92G01); B.C. Ministry of Energy and Mines, Open File 1998-12.
Hickin, A.S., Brooks, E.D., Dixon-Warren, A.B., and Bobrowsky, P.T. (2001); Sea-to-Sky Aggregate Potential Mapping Project (parts of NTS 092J02,03,06,07,08,09,10,11,12), B.C. Ministry of Energy and Mines, Fieldwork 2000, Paper 2001-1, pp 411-421. (PDF document, 6.8 Mb)
Dixon-Warren, A.B., Brooks, E.D., and Bobrowsky, P.T. (2000); Aggregate Resource Potential of the Sea-to-Sky Highway Area (NTS 092G11,14), B.C. Ministry of Energy and Mines, Open File 2000-30, digital data, see Open File 2001-12.
Hickin, A.S., Brooks, E.D., and Bobrowsky, P.T. (2001); North Coast Aggregate Potential Project, B.C. Ministry of Energy and Mines, Open File 2001-19.
Matheson, A., Massey, N.W.D., Bobrowsky, P.T., Kilby, C.E. and Manson, G. (1996): Aggregate Inventory of British Columbia - Private Pits; B.C. Ministry of Energy, Mines and Petroleum Resources, Open File 1996-5.

